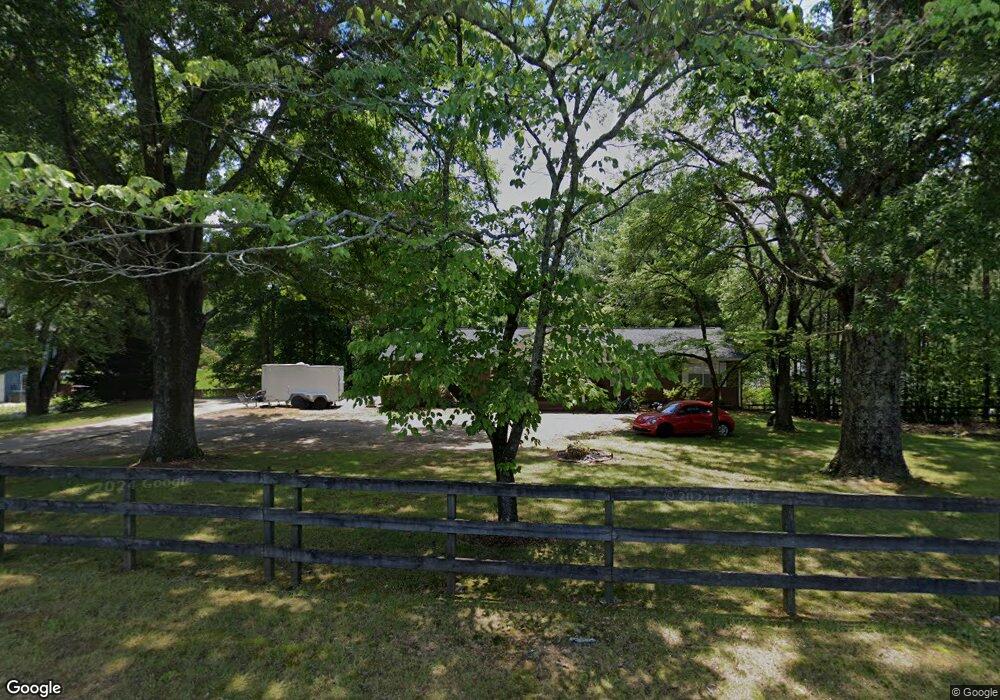
5289 Hopgood Rd Acworth, GA 30102
Oak Grove NeighborhoodEstimated Value: $305,000 - $387,000
3
Beds
2
Baths
1,768
Sq Ft
$190/Sq Ft
Est. Value
About This Home
This home is located at 5289 Hopgood Rd, Acworth, GA 30102 and is currently estimated at $335,625, approximately $189 per square foot. 5289 Hopgood Rd is a home located in Cherokee County with nearby schools including E. T. Booth Middle School, Etowah High School, and Keystone Prep Academy.
Ownership History
Date
Name
Owned For
Owner Type
Purchase Details
Closed on
Mar 16, 2012
Sold by
Chang Yen
Bought by
Erentalusa Llc
Current Estimated Value
Purchase Details
Closed on
Feb 8, 2008
Sold by
Rogers Kenneth S and Rogers Sandra E
Bought by
Chang Yen T
Home Financials for this Owner
Home Financials are based on the most recent Mortgage that was taken out on this home.
Original Mortgage
$104,000
Interest Rate
5.65%
Purchase Details
Closed on
Oct 14, 2002
Sold by
Rogers Kenneth S
Bought by
Rogers Kenneth S and Rogers Sandra E
Home Financials for this Owner
Home Financials are based on the most recent Mortgage that was taken out on this home.
Original Mortgage
$80,000
Interest Rate
6.18%
Purchase Details
Closed on
Nov 29, 2001
Sold by
Rogers Kenneth S
Bought by
Rogers Kenneth S and Rogers Sandra E
Home Financials for this Owner
Home Financials are based on the most recent Mortgage that was taken out on this home.
Original Mortgage
$300,000
Interest Rate
6.25%
Create a Home Valuation Report for This Property
The Home Valuation Report is an in-depth analysis detailing your home's value as well as a comparison with similar homes in the area
Home Values in the Area
Average Home Value in this Area
Purchase History
| Date | Buyer | Sale Price | Title Company |
|---|---|---|---|
| Erentalusa Llc | $130,000 | -- | |
| Chang Yen T | $130,000 | -- | |
| Rogers Kenneth S | -- | -- | |
| Rogers Kenneth S | -- | -- |
Source: Public Records
Mortgage History
| Date | Status | Borrower | Loan Amount |
|---|---|---|---|
| Previous Owner | Chang Yen T | $104,000 | |
| Previous Owner | Rogers Kenneth S | $80,000 | |
| Previous Owner | Rogers Kenneth S | $300,000 |
Source: Public Records
Tax History Compared to Growth
Tax History
| Year | Tax Paid | Tax Assessment Tax Assessment Total Assessment is a certain percentage of the fair market value that is determined by local assessors to be the total taxable value of land and additions on the property. | Land | Improvement |
|---|---|---|---|---|
| 2025 | $2,307 | $87,852 | $24,000 | $63,852 |
| 2024 | $2,139 | $82,292 | $18,000 | $64,292 |
| 2023 | $2,079 | $80,012 | $18,000 | $62,012 |
| 2022 | $1,774 | $67,492 | $18,000 | $49,492 |
| 2021 | $1,274 | $44,892 | $15,360 | $29,532 |
| 2020 | $1,252 | $44,052 | $15,360 | $28,692 |
| 2019 | $1,165 | $41,000 | $15,360 | $25,640 |
| 2018 | $1,173 | $41,040 | $15,360 | $25,680 |
| 2017 | $1,139 | $98,800 | $14,480 | $25,040 |
| 2016 | $1,034 | $88,800 | $12,200 | $23,320 |
| 2015 | $1,058 | $90,000 | $12,200 | $23,800 |
| 2014 | $1,005 | $85,300 | $10,840 | $23,280 |
Source: Public Records
Map
Nearby Homes
- 5307 Shadow Cir
- 5357 Wade Green Rd
- 243 Odell St
- 5512 Arrowhead Dr
- 5384 Blackhawk Dr
- 5523 Cheyenne Dr
- 0 Alabama Rd
- 5543 Forest Dr
- 2310 Cascade Dr
- 821 Tramore Rd
- 5674 Woodland Dr
- 1673 Clearview Dr NW
- 4815 Wade Green Rd NW Unit 1
- 4815 Wade Green Rd NW
- 5464 Wade Green Rd
- 1071 Ferry Creek Way
- 1220 Wade Green Cir NW Unit 1
- 5666 Goldfield Dr
- 140 Bryon Ln
- 5285 Hopgood Rd
- 5260 Hopgood Rd
- 5301 Hopgood Rd
- 5271 Hopgood Rd
- 1600 Shadowbrook Dr
- 5322 Shadow Cir
- 5370 Hopgood Rd
- 5305 Hopgood Rd
- 1606 Shadowbrook Dr
- 5323 Shadow Cir Unit 1
- 1601 Shadowbrook Dr
- 1612 Shadowbrook Dr
- 1605 Shadowbrook Dr
- 5361 Wade Green Rd
- 5309 Hopgood Rd
- 5319 Shadow Cir
- 5253 Hopgood Rd
- 0 Shadow Cir
- o Shadowbrook Dr
- 5313 Shadow Cir Unit 1