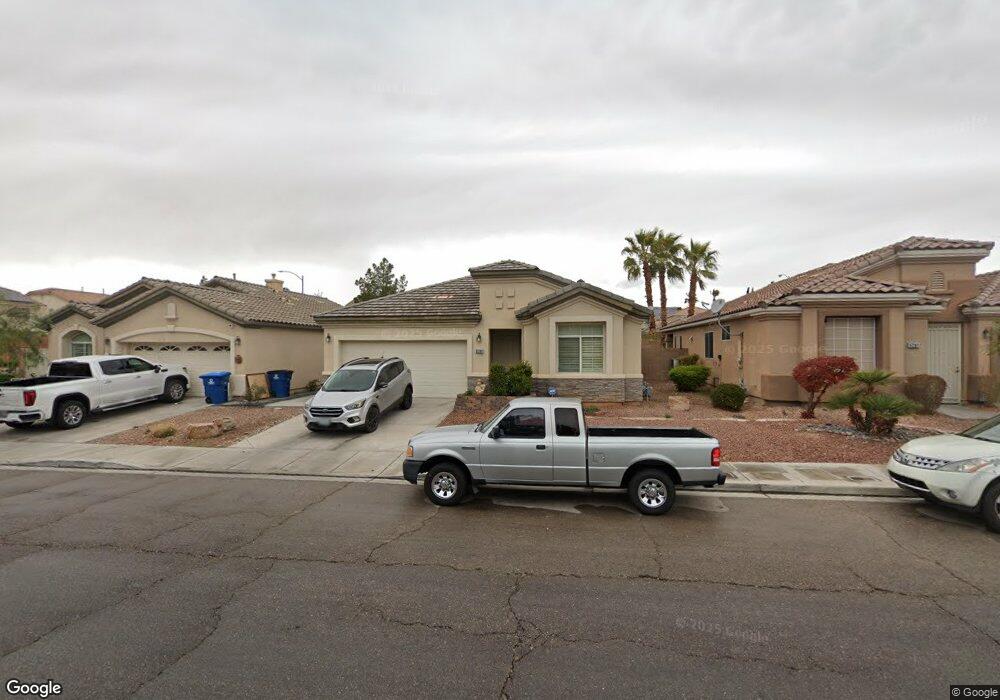
5289 S Tee Pee Ln Las Vegas, NV 89148
Estimated Value: $421,000 - $510,000
2
Beds
2
Baths
1,468
Sq Ft
$321/Sq Ft
Est. Value
About This Home
This home is located at 5289 S Tee Pee Ln, Las Vegas, NV 89148 and is currently estimated at $471,184, approximately $320 per square foot. 5289 S Tee Pee Ln is a home located in Clark County with nearby schools including Sandra B Abston Elementary School, Victoria Fertitta Middle School, and Durango High School.
Ownership History
Date
Name
Owned For
Owner Type
Purchase Details
Closed on
Jun 12, 2003
Sold by
Rochinia Dikranoohy Dee
Bought by
Schultheis Jeffrey A and Schultheis Diana Lyn
Current Estimated Value
Home Financials for this Owner
Home Financials are based on the most recent Mortgage that was taken out on this home.
Original Mortgage
$164,750
Outstanding Balance
$68,861
Interest Rate
5.15%
Mortgage Type
Unknown
Estimated Equity
$402,323
Purchase Details
Closed on
Nov 26, 2002
Sold by
Pinnacle Aurora V Ltd Partnership
Bought by
Roohinia Dikranoohy Dee
Home Financials for this Owner
Home Financials are based on the most recent Mortgage that was taken out on this home.
Original Mortgage
$143,000
Interest Rate
5.96%
Create a Home Valuation Report for This Property
The Home Valuation Report is an in-depth analysis detailing your home's value as well as a comparison with similar homes in the area
Home Values in the Area
Average Home Value in this Area
Purchase History
| Date | Buyer | Sale Price | Title Company |
|---|---|---|---|
| Schultheis Jeffrey A | $205,950 | Old Republic Title Company | |
| Roohinia Dikranoohy Dee | $198,392 | Old Republic Title Company |
Source: Public Records
Mortgage History
| Date | Status | Borrower | Loan Amount |
|---|---|---|---|
| Open | Schultheis Jeffrey A | $164,750 | |
| Previous Owner | Roohinia Dikranoohy Dee | $143,000 |
Source: Public Records
Tax History Compared to Growth
Tax History
| Year | Tax Paid | Tax Assessment Tax Assessment Total Assessment is a certain percentage of the fair market value that is determined by local assessors to be the total taxable value of land and additions on the property. | Land | Improvement |
|---|---|---|---|---|
| 2025 | $2,654 | $126,868 | $42,700 | $84,168 |
| 2024 | $2,458 | $126,868 | $42,700 | $84,168 |
| 2023 | $2,458 | $116,310 | $37,450 | $78,860 |
| 2022 | $2,276 | $104,312 | $31,850 | $72,462 |
| 2021 | $2,108 | $97,094 | $28,350 | $68,744 |
| 2020 | $1,954 | $93,606 | $25,550 | $68,056 |
| 2019 | $1,831 | $90,542 | $23,450 | $67,092 |
| 2018 | $1,747 | $85,706 | $21,000 | $64,706 |
| 2017 | $2,447 | $83,426 | $17,808 | $65,618 |
| 2016 | $1,636 | $77,582 | $13,440 | $64,142 |
| 2015 | $1,633 | $74,722 | $10,080 | $64,642 |
| 2014 | $1,585 | $52,428 | $8,064 | $44,364 |
Source: Public Records
Map
Nearby Homes
- 9631 Tuscola Ct
- 9522 Arrowhead Falls Ct
- 9687 Ridgebluff Ave
- 9693 Bighorn Island Ave
- 9731 Cathedral Stairs Ct
- 9472 W Diablo Dr
- 9580 W Reno Ave Unit 261
- 9580 W Reno Ave Unit 240
- 9580 W Reno Ave Unit 233
- 9580 W Reno Ave Unit 238
- 5048 Orchid Springs St
- 9862 Shadow Grove Ave
- 5076 Thunder River Cir
- 9821 Sedona Shrine Ave
- 5554 Chicory Falls Ct
- 5077 Thunder River Cir
- 5014 Thunder River Cir
- 5015 Thunder River Cir
- 5533 Sterling Valley Ct
- 9750 Maple Sugar Leaf Place
- 5297 S Tee Pee Ln
- 5281 S Tee Pee Ln
- 5298 Blue Gum Ct
- 5298 Blue Gum Ct
- 5273 S Tee Pee Ln
- 5282 Blue Gum Ct
- 9591 Camelback Peak Ct
- 5274 Blue Gum Ct
- 5265 S Tee Pee Ln
- 9585 Camelback Peak Ct
- 5266 Blue Gum Ct
- 9592 Camelback Peak Ct
- 5299 Blue Gum Ct
- 5257 S Tee Pee Ln
- 9579 Camelback Peak Ct
- 9618 Tuscola Ct
- 9612 Tuscola Ct
- 9586 Camelback Peak Ct
- 5258 Blue Gum Ct
- 5283 Blue Gum Ct