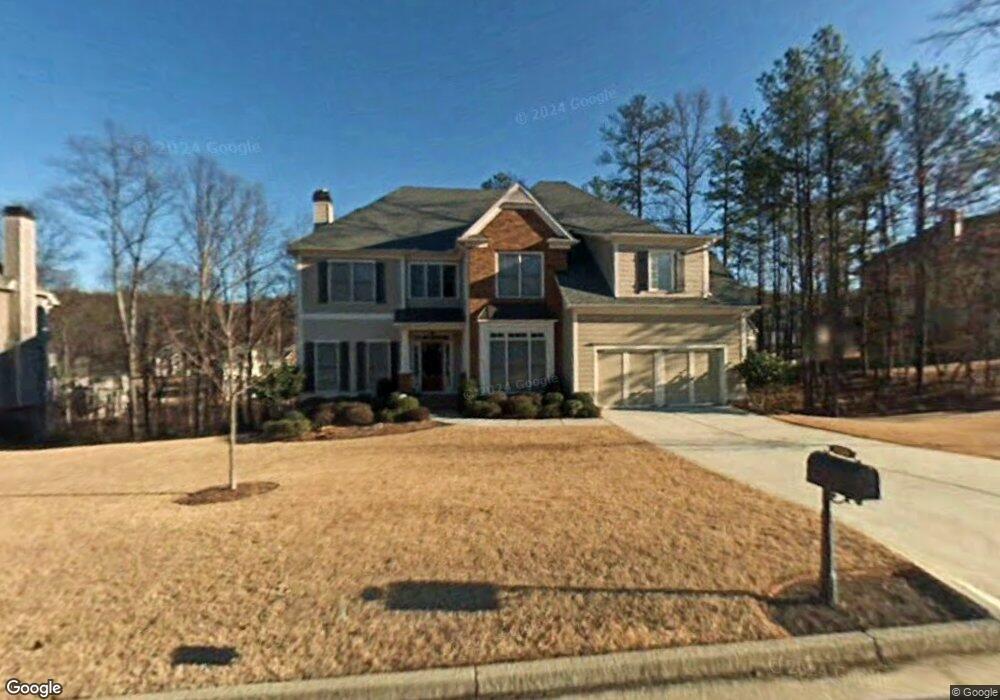
5289 Vinings Springs Trail Mableton, GA 30126
Estimated Value: $678,000 - $821,000
4
Beds
4
Baths
3,348
Sq Ft
$223/Sq Ft
Est. Value
About This Home
This home is located at 5289 Vinings Springs Trail, Mableton, GA 30126 and is currently estimated at $746,484, approximately $222 per square foot. 5289 Vinings Springs Trail is a home located in Cobb County with nearby schools including Nickajack Elementary School, Griffin Middle School, and Campbell High School.
Ownership History
Date
Name
Owned For
Owner Type
Purchase Details
Closed on
May 13, 2022
Sold by
Johns Yvonne R
Bought by
Johns Yvonne R and Johns Eric B
Current Estimated Value
Purchase Details
Closed on
Nov 12, 2004
Sold by
Gale Bryan R and Gale Shelley
Bought by
Johns Yvonne R
Home Financials for this Owner
Home Financials are based on the most recent Mortgage that was taken out on this home.
Original Mortgage
$322,400
Interest Rate
5.77%
Mortgage Type
New Conventional
Purchase Details
Closed on
Nov 5, 2003
Sold by
Odwyer Homes Inc
Bought by
Gale Bryan R and Gale Shelley
Home Financials for this Owner
Home Financials are based on the most recent Mortgage that was taken out on this home.
Original Mortgage
$281,400
Interest Rate
4.5%
Mortgage Type
New Conventional
Create a Home Valuation Report for This Property
The Home Valuation Report is an in-depth analysis detailing your home's value as well as a comparison with similar homes in the area
Home Values in the Area
Average Home Value in this Area
Purchase History
| Date | Buyer | Sale Price | Title Company |
|---|---|---|---|
| Johns Yvonne R | -- | Postic Lionel J | |
| Johns Yvonne R | $403,000 | -- | |
| Gale Bryan R | $359,500 | -- |
Source: Public Records
Mortgage History
| Date | Status | Borrower | Loan Amount |
|---|---|---|---|
| Previous Owner | Johns Yvonne R | $322,400 | |
| Previous Owner | Gale Bryan R | $281,400 |
Source: Public Records
Tax History Compared to Growth
Tax History
| Year | Tax Paid | Tax Assessment Tax Assessment Total Assessment is a certain percentage of the fair market value that is determined by local assessors to be the total taxable value of land and additions on the property. | Land | Improvement |
|---|---|---|---|---|
| 2024 | $6,154 | $240,616 | $50,000 | $190,616 |
| 2023 | $5,612 | $240,616 | $50,000 | $190,616 |
| 2022 | $4,634 | $169,068 | $36,000 | $133,068 |
| 2021 | $4,634 | $169,068 | $36,000 | $133,068 |
| 2020 | $4,634 | $169,068 | $36,000 | $133,068 |
| 2019 | $4,364 | $156,732 | $28,000 | $128,732 |
| 2018 | $4,364 | $156,732 | $28,000 | $128,732 |
| 2017 | $4,154 | $156,732 | $28,000 | $128,732 |
| 2016 | $4,027 | $150,840 | $26,000 | $124,840 |
| 2015 | $4,125 | $150,840 | $26,000 | $124,840 |
| 2014 | $3,410 | $123,596 | $0 | $0 |
Source: Public Records
Map
Nearby Homes
- 540 Cool Creek Trail SE
- 622 Denali Dr
- 5394 Pebblebrook Ln SE
- 560 Cool Creek Trail SE
- 5106 Vinings Estates Way SE
- 5379 Windsor Green Ct SE Unit VIII
- 5377 Windsor Green Ct SE
- 658 Vinings Estates Dr SE
- 476 Cooper Lake Rd SE
- 5071 Vinings Estates Ct SE
- 5006 Lake Mist Dr SE
- 932 Pebblebrook Rd SE
- 220 Ridgecrest Rd SE
- 235 Saint Martins Dr SE
- 5344 Saint Martins Ct SE
- 5511 Highland Preserve Dr
- 5287 Vinings Springs Trail
- 575 Vinings Springs Dr SE
- 5291 Vinings Springs Trail
- 5285 Vinings Springs Trail
- 5286 Vinings Springs Trail
- 577 Vinings Springs Dr SE
- 5284 Vinings Springs Trail Unit II
- 5290 Vinings Springs Trail Unit 2
- 5288 Vinings Springs Trail
- 5308 Vinings Springs Point
- 5310 Vinings Springs Point
- 5283 Vinings Springs Trail Unit II
- 5283 Vinings Springs Trail Unit 41
- 5306 Vinings Springs Point
- 576 Vinings Springs Dr SE
- 576 Vinings Springs Dr SE
- 565 Vinings Springs Dr SE
- 5312 Vinings Springs
- 5312 Vinings Springs Point
- 570 Vinings Springs Dr SE