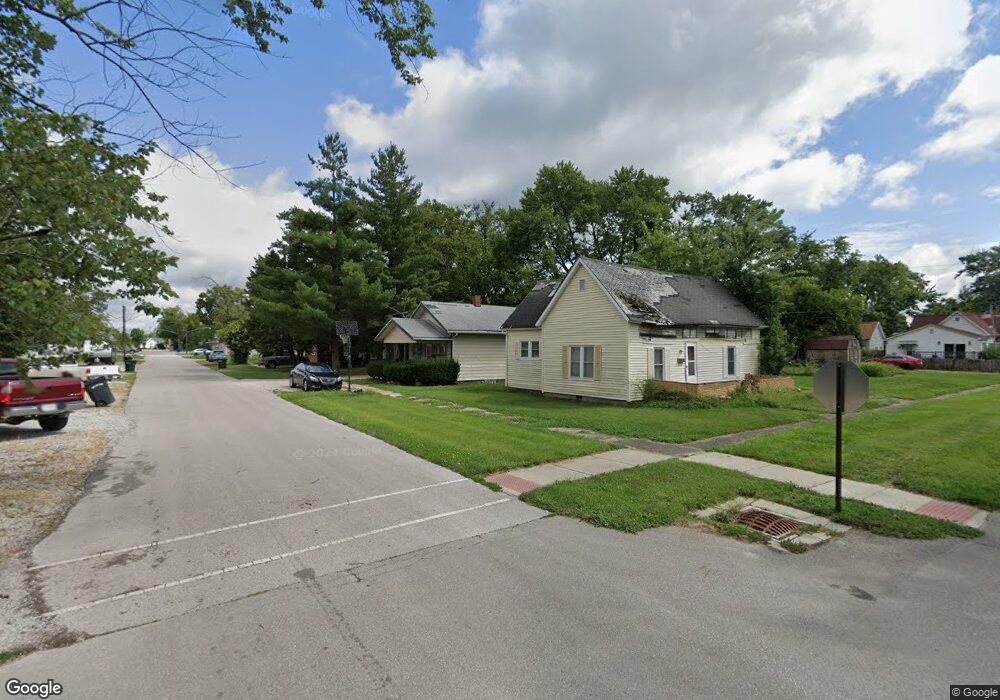
529 3rd St NW Linton, IN 47441
Estimated Value: $92,000 - $127,000
--
Bed
1
Bath
896
Sq Ft
$125/Sq Ft
Est. Value
About This Home
This home is located at 529 3rd St NW, Linton, IN 47441 and is currently estimated at $112,182, approximately $125 per square foot. 529 3rd St NW is a home located in Greene County with nearby schools including Linton-Stockton Elementary School, Linton-Stockton Junior High School, and Linton-Stockton High School.
Ownership History
Date
Name
Owned For
Owner Type
Purchase Details
Closed on
Mar 9, 2016
Sold by
Miller George E and Miller Martha L
Bought by
Land Becky
Current Estimated Value
Purchase Details
Closed on
Sep 12, 2008
Sold by
Shoaf Marsha K
Bought by
Miller George E and Miller Martha L
Home Financials for this Owner
Home Financials are based on the most recent Mortgage that was taken out on this home.
Original Mortgage
$53,865
Interest Rate
6.57%
Mortgage Type
New Conventional
Purchase Details
Closed on
Dec 20, 2007
Sold by
Shoaf Marsha K and The Margaret L Miller Trusted
Bought by
Shoaf Marsha K
Create a Home Valuation Report for This Property
The Home Valuation Report is an in-depth analysis detailing your home's value as well as a comparison with similar homes in the area
Home Values in the Area
Average Home Value in this Area
Purchase History
| Date | Buyer | Sale Price | Title Company |
|---|---|---|---|
| Land Becky | -- | -- | |
| Miller George E | -- | None Available | |
| Shoaf Marsha K | -- | None Available |
Source: Public Records
Mortgage History
| Date | Status | Borrower | Loan Amount |
|---|---|---|---|
| Previous Owner | Miller George E | $53,865 |
Source: Public Records
Tax History Compared to Growth
Tax History
| Year | Tax Paid | Tax Assessment Tax Assessment Total Assessment is a certain percentage of the fair market value that is determined by local assessors to be the total taxable value of land and additions on the property. | Land | Improvement |
|---|---|---|---|---|
| 2024 | $637 | $62,500 | $6,500 | $56,000 |
| 2023 | $611 | $61,900 | $6,500 | $55,400 |
| 2022 | $537 | $63,700 | $6,500 | $57,200 |
| 2021 | $540 | $60,300 | $6,500 | $53,800 |
| 2020 | $502 | $60,300 | $6,500 | $53,800 |
| 2019 | $532 | $60,300 | $6,500 | $53,800 |
| 2018 | $514 | $60,300 | $6,500 | $53,800 |
| 2017 | $492 | $59,700 | $6,500 | $53,200 |
| 2016 | $477 | $60,700 | $6,500 | $54,200 |
| 2014 | $403 | $56,800 | $6,500 | $50,300 |
| 2013 | -- | $56,200 | $6,500 | $49,700 |
Source: Public Records
Map
Nearby Homes