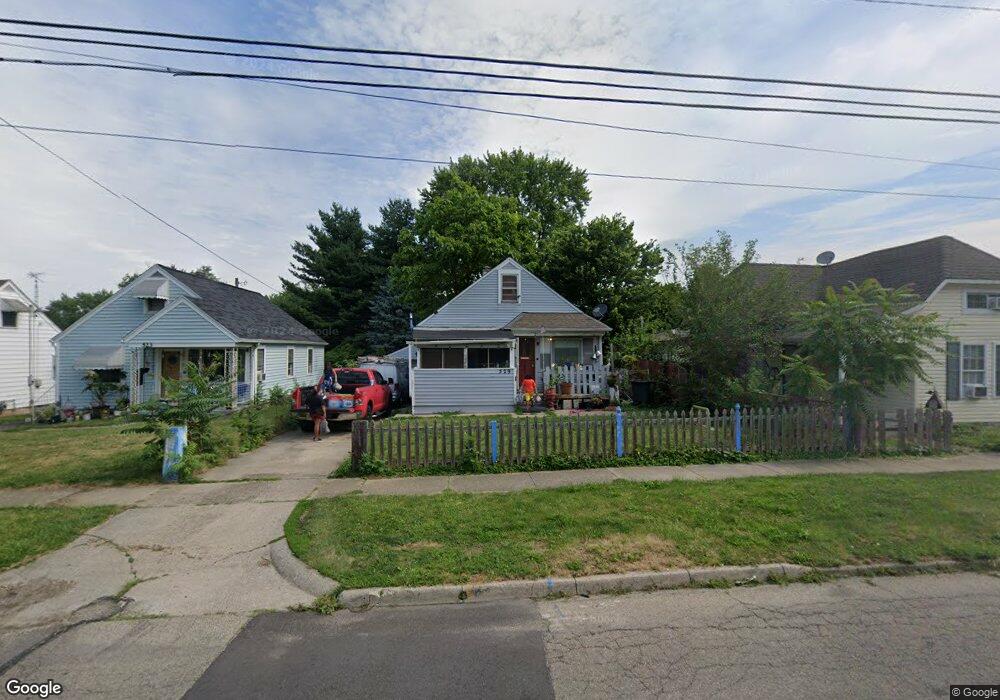
529 Burkhardt Ave Dayton, OH 45403
Wright View NeighborhoodEstimated Value: $95,000 - $114,000
2
Beds
1
Bath
922
Sq Ft
$111/Sq Ft
Est. Value
About This Home
This home is located at 529 Burkhardt Ave, Dayton, OH 45403 and is currently estimated at $102,552, approximately $111 per square foot. 529 Burkhardt Ave is a home located in Montgomery County with nearby schools including Ruskin Elementary School, Kiser Elementary, and Horizon Science Academy Dayton Downtown.
Ownership History
Date
Name
Owned For
Owner Type
Purchase Details
Closed on
Nov 12, 2018
Sold by
Bustamante David Soria
Bought by
Alvarez David Soria
Current Estimated Value
Purchase Details
Closed on
Oct 17, 2010
Sold by
Perez Ramon and Perez Leticia
Bought by
Bustamante David Soria
Purchase Details
Closed on
Oct 28, 2009
Sold by
Secretary Of Housing & Urban Development
Bought by
Perez Ramon
Purchase Details
Closed on
May 6, 2009
Sold by
Chase Home Finance Llc
Bought by
Secretary Of Housing & Urban Development
Purchase Details
Closed on
May 5, 2009
Sold by
Miller Stoney J
Bought by
Chase Home Finance Llc
Purchase Details
Closed on
Aug 1, 2005
Sold by
Stockler Gracie
Bought by
Miller Erin N and Miller Stoney J
Home Financials for this Owner
Home Financials are based on the most recent Mortgage that was taken out on this home.
Original Mortgage
$50,000
Interest Rate
8.05%
Mortgage Type
Fannie Mae Freddie Mac
Purchase Details
Closed on
Jan 24, 2000
Sold by
Stockler Marvin E
Bought by
Stockler Marvin E and Stockler Gracie
Create a Home Valuation Report for This Property
The Home Valuation Report is an in-depth analysis detailing your home's value as well as a comparison with similar homes in the area
Home Values in the Area
Average Home Value in this Area
Purchase History
| Date | Buyer | Sale Price | Title Company |
|---|---|---|---|
| Alvarez David Soria | -- | Partners Land Title Agency | |
| Bustamante David Soria | -- | Attorney | |
| Perez Ramon | $10,000 | Lakeside Title & Escrow Agen | |
| Secretary Of Housing & Urban Development | -- | None Available | |
| Chase Home Finance Llc | $24,000 | None Available | |
| Miller Erin N | $62,500 | Multiple | |
| Stockler Marvin E | -- | -- |
Source: Public Records
Mortgage History
| Date | Status | Borrower | Loan Amount |
|---|---|---|---|
| Previous Owner | Miller Erin N | $50,000 |
Source: Public Records
Tax History Compared to Growth
Tax History
| Year | Tax Paid | Tax Assessment Tax Assessment Total Assessment is a certain percentage of the fair market value that is determined by local assessors to be the total taxable value of land and additions on the property. | Land | Improvement |
|---|---|---|---|---|
| 2024 | $1,245 | $21,440 | $3,690 | $17,750 |
| 2023 | $1,245 | $21,440 | $3,690 | $17,750 |
| 2022 | $1,072 | $14,230 | $2,440 | $11,790 |
| 2021 | $1,066 | $14,230 | $2,440 | $11,790 |
| 2020 | $1,064 | $14,230 | $2,440 | $11,790 |
| 2019 | $1,162 | $13,960 | $3,260 | $10,700 |
| 2018 | $1,134 | $13,960 | $3,260 | $10,700 |
| 2017 | $1,125 | $13,960 | $3,260 | $10,700 |
| 2016 | $1,105 | $13,030 | $3,260 | $9,770 |
| 2015 | $1,046 | $13,030 | $3,260 | $9,770 |
| 2014 | $1,046 | $13,030 | $3,260 | $9,770 |
| 2012 | -- | $17,900 | $3,280 | $14,620 |
Source: Public Records
Map
Nearby Homes
- 223 Pleasant Ave
- 161 S Harbine Ave
- 153 S Hedges St
- 1323 Huffman Ave
- 111 S Hedges St
- 101 S Delmar Ave
- 3007 E 4th St
- 2929 E 5th St
- 40 Klee Ave
- 2821 E 5th St Unit 2819
- 240 Bierce Ave
- 755 Huffman Ave
- 227 Livingston Ave Unit 225
- 515 Heiss Ave Unit 515-517
- 2103 E 4th St
- 631 Greenlawn Ave
- 28 More Ave
- 102 S Findlay St
- 100 N Irwin St
- 639 Huffman Ave
- 523 Burkhardt Ave
- 533 Burkhardt Ave
- 249 S Garland Ave
- 519 Burkhardt Ave
- 243 S Garland Ave
- 513 Burkhardt Ave
- 239 S Garland Ave
- 509 Burkhardt Ave
- 262 S Hedges St
- 530 Burkhardt Ave
- 522 Burkhardt Ave
- 532 Burkhardt Ave
- 256 S Hedges St
- 260 S Garland Ave
- 254 S Garland Ave
- 235 S Garland Ave
- 512 Burkhardt Ave
- 272 S Hedges St
- 248 S Garland Ave
- 250 S Hedges St