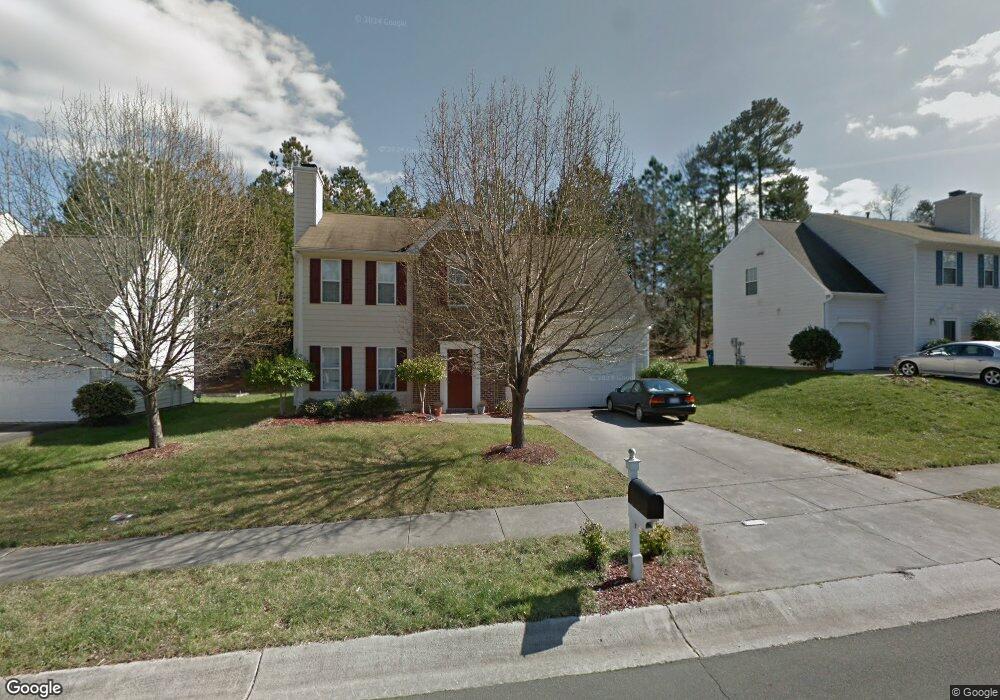
529 Crossview Ln Durham, NC 27703
Eastern Durham NeighborhoodEstimated Value: $380,130 - $413,000
4
Beds
3
Baths
1,878
Sq Ft
$211/Sq Ft
Est. Value
About This Home
This home is located at 529 Crossview Ln, Durham, NC 27703 and is currently estimated at $395,783, approximately $210 per square foot. 529 Crossview Ln is a home located in Durham County with nearby schools including Oak Grove Elementary, John W Neal Middle School, and Southern School of Energy & Sustainability.
Ownership History
Date
Name
Owned For
Owner Type
Purchase Details
Closed on
Aug 11, 2000
Sold by
D R Horton Inc Torrey
Bought by
Holland David and Holland Cynthia
Current Estimated Value
Home Financials for this Owner
Home Financials are based on the most recent Mortgage that was taken out on this home.
Original Mortgage
$155,815
Outstanding Balance
$56,536
Interest Rate
8.23%
Mortgage Type
FHA
Estimated Equity
$339,247
Create a Home Valuation Report for This Property
The Home Valuation Report is an in-depth analysis detailing your home's value as well as a comparison with similar homes in the area
Home Values in the Area
Average Home Value in this Area
Purchase History
| Date | Buyer | Sale Price | Title Company |
|---|---|---|---|
| Holland David | $157,500 | -- |
Source: Public Records
Mortgage History
| Date | Status | Borrower | Loan Amount |
|---|---|---|---|
| Open | Holland David | $155,815 |
Source: Public Records
Tax History
| Year | Tax Paid | Tax Assessment Tax Assessment Total Assessment is a certain percentage of the fair market value that is determined by local assessors to be the total taxable value of land and additions on the property. | Land | Improvement |
|---|---|---|---|---|
| 2025 | $3,695 | $372,768 | $61,211 | $311,557 |
| 2024 | $3,002 | $215,228 | $44,512 | $170,716 |
| 2023 | $2,819 | $215,228 | $44,512 | $170,716 |
| 2022 | $2,755 | $215,228 | $44,512 | $170,716 |
| 2021 | $2,742 | $215,228 | $44,512 | $170,716 |
| 2020 | $2,677 | $215,228 | $44,512 | $170,716 |
| 2019 | $2,677 | $215,228 | $44,512 | $170,716 |
| 2018 | $2,289 | $168,708 | $32,642 | $136,066 |
| 2017 | $2,272 | $168,708 | $32,642 | $136,066 |
| 2016 | $2,195 | $168,708 | $32,642 | $136,066 |
| 2015 | $2,295 | $165,767 | $32,623 | $133,144 |
| 2014 | $2,295 | $165,767 | $32,623 | $133,144 |
Source: Public Records
Map
Nearby Homes
- 604 Bellmeade Bay Dr
- 501 Bellmeade Bay Dr
- 411 Bellmeade Bay Dr
- 3908 Holder Rd
- 615 Southshore Pkwy
- 907 Danbury Dr
- 4 Jarvis Ct
- 1315 Pennock Rd
- 210 Stoney Creek Cir
- 601 Crossing Dr
- 1107 High Fox Dr
- 208 Lick Creek Ln
- 1015 Sora Way
- 110 Kindlewood Dr
- 442 Gus Rd
- 610 Sherron Rd
- 111 Glenview Ln
- 517 Keith St
- 102 Harvest Oaks Ln Unit 38
- 2055 Tanners Mill Dr
- 527 Crossview Ln
- 533 Crossview Ln
- 535 Crossview Ln
- 714 Bellmeade Bay Dr
- 525 Crossview Ln
- 712 Bellmeade Bay Dr
- 716 Bellmeade Bay Dr
- 708 Bellmeade Bay Dr
- 530 Crossview Ln
- 532 Crossview Ln
- 528 Crossview Ln
- 523 Crossview Ln
- 534 Crossview Ln
- 526 Crossview Ln
- 718 Bellmeade Bay Dr
- 706 Bellmeade Bay Dr
- 536 Crossview Ln
- 524 Crossview Ln
- 521 Crossview Ln
- 539 Crossview Ln
Your Personal Tour Guide
Ask me questions while you tour the home.