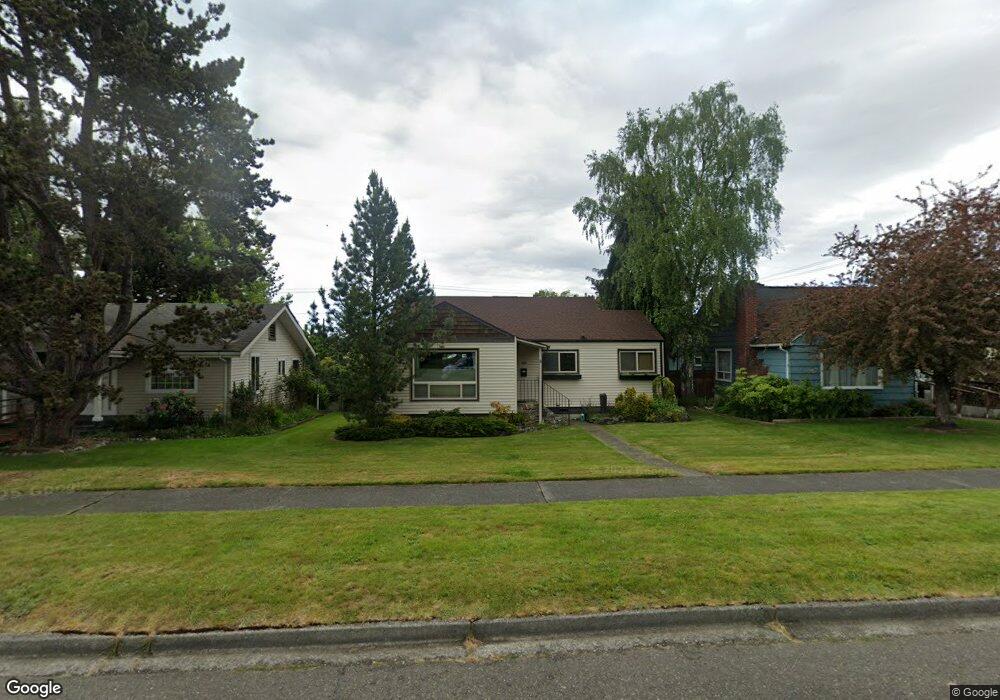
529 E 9th St Port Angeles, WA 98362
Estimated Value: $380,000 - $396,725
2
Beds
1
Bath
1,399
Sq Ft
$278/Sq Ft
Est. Value
About This Home
This home is located at 529 E 9th St, Port Angeles, WA 98362 and is currently estimated at $389,242, approximately $278 per square foot. 529 E 9th St is a home located in Clallam County with nearby schools including Franklin Elementary School, Stevens Middle School, and Port Angeles High School.
Ownership History
Date
Name
Owned For
Owner Type
Purchase Details
Closed on
Oct 23, 2014
Sold by
Church Jeremy C and Church Marlene Ann
Bought by
Sager Sandra L
Current Estimated Value
Home Financials for this Owner
Home Financials are based on the most recent Mortgage that was taken out on this home.
Original Mortgage
$100,000
Outstanding Balance
$76,946
Interest Rate
4.2%
Mortgage Type
New Conventional
Estimated Equity
$312,296
Purchase Details
Closed on
Aug 1, 2012
Sold by
Church Jeremy C
Bought by
Church Jeremy C and Church Marlene Ann
Home Financials for this Owner
Home Financials are based on the most recent Mortgage that was taken out on this home.
Original Mortgage
$177,638
Interest Rate
3.5%
Mortgage Type
FHA
Purchase Details
Closed on
May 2, 2007
Sold by
Hanson Glorene R
Bought by
Church Jeremy
Home Financials for this Owner
Home Financials are based on the most recent Mortgage that was taken out on this home.
Original Mortgage
$187,000
Interest Rate
6.87%
Mortgage Type
Adjustable Rate Mortgage/ARM
Create a Home Valuation Report for This Property
The Home Valuation Report is an in-depth analysis detailing your home's value as well as a comparison with similar homes in the area
Home Values in the Area
Average Home Value in this Area
Purchase History
| Date | Buyer | Sale Price | Title Company |
|---|---|---|---|
| Sager Sandra L | $200,000 | Olympic Peninsula Title Co | |
| Church Jeremy C | -- | Olympic Peninsula Title Comp | |
| Church Jeremy | $187,000 | Clallam Title Co |
Source: Public Records
Mortgage History
| Date | Status | Borrower | Loan Amount |
|---|---|---|---|
| Open | Sager Sandra L | $100,000 | |
| Previous Owner | Church Jeremy C | $177,638 | |
| Previous Owner | Church Jeremy | $187,000 |
Source: Public Records
Tax History Compared to Growth
Tax History
| Year | Tax Paid | Tax Assessment Tax Assessment Total Assessment is a certain percentage of the fair market value that is determined by local assessors to be the total taxable value of land and additions on the property. | Land | Improvement |
|---|---|---|---|---|
| 2021 | $2,689 | $212,373 | $50,000 | $162,373 |
| 2020 | $2,150 | $204,046 | $50,000 | $154,046 |
| 2018 | $1,768 | $165,254 | $50,000 | $115,254 |
| 2017 | $1,598 | $138,742 | $50,000 | $88,742 |
| 2016 | $1,598 | $140,492 | $50,000 | $90,492 |
| 2015 | $1,598 | $128,781 | $50,000 | $78,781 |
| 2013 | $1,598 | $123,759 | $50,000 | $73,759 |
| 2012 | $1,598 | $136,596 | $53,125 | $83,471 |
Source: Public Records
Map
Nearby Homes
- 703 E 10th St
- 733 E 10th St
- 733 E 10th St Unit 733 E. Tenth Street
- 219 E 8th St
- 216 E 9th St
- 817 E 7th St
- 1110 S Chase St
- 220 Lopez Ave
- 618 E Whidby Ave
- 834 E 4th St
- 702 & 702 1/2 E 2nd St
- 702 E 2nd St Unit 7025
- 429 E Whidby Ave
- 117 W 10th St
- 633 E Park Ave
- 814 E 2nd St
- 2608 S Washington St
- 501 E 1st St
- 126 W 6th St
- 535 E 9th St
- 525 E 9th St
- 521 E 9th St
- 519 E 9th St
- 530 E 8th St
- 526 E 8th St
- 601 E 9th St
- 515 E 9th St
- 540 E 8th St
- 540 E 8th St Unit 810 S Albert St
- 528 E 9th St
- 536 E 9th St
- 605 E 9th St
- 520 E 8th St
- 520 E 8th St Unit 520 E Eighth
- 524 E 9th St
- 511 E 9th St
- 516 E 8th St
- 520 E 9th St
- 903 S Albert St