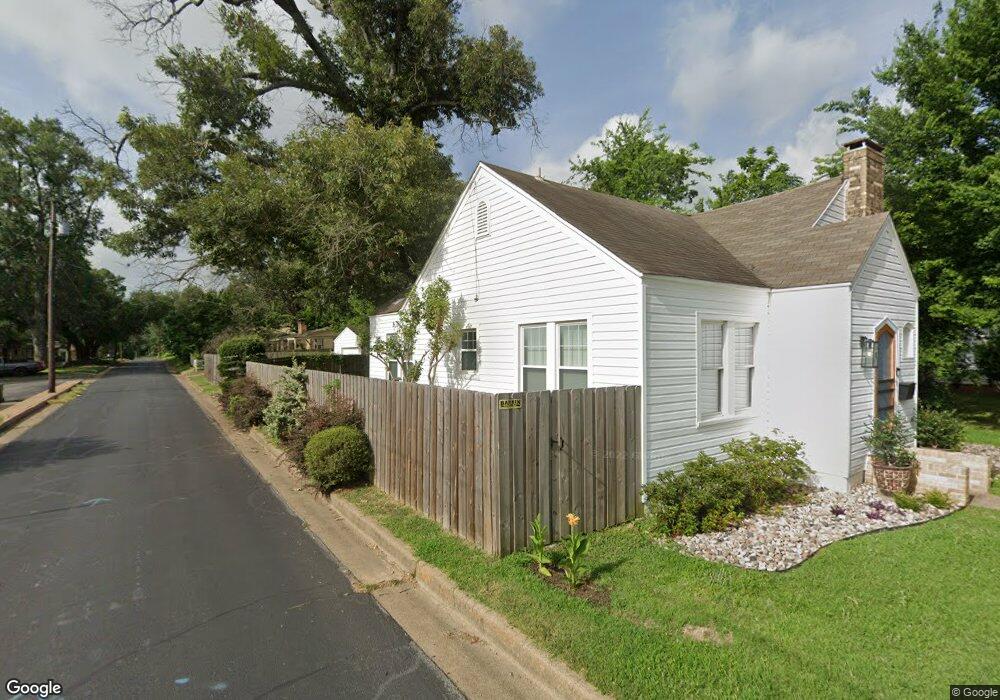
529 E Dodge St Tyler, TX 75701
Azalea District Neighborhood
2
Beds
1
Bath
1,265
Sq Ft
6,098
Sq Ft Lot
About This Home
This home is located at 529 E Dodge St, Tyler, TX 75701. 529 E Dodge St is a home located in Smith County with nearby schools including Bell Elementary School, Hubbard Middle School, and Tyler Legacy High School.
Create a Home Valuation Report for This Property
The Home Valuation Report is an in-depth analysis detailing your home's value as well as a comparison with similar homes in the area
Home Values in the Area
Average Home Value in this Area
Tax History
| Year | Tax Paid | Tax Assessment Tax Assessment Total Assessment is a certain percentage of the fair market value that is determined by local assessors to be the total taxable value of land and additions on the property. | Land | Improvement |
|---|---|---|---|---|
| 2025 | $2,951 | $173,456 | $26,282 | $156,060 |
| 2024 | $2,951 | $173,456 | $26,282 | $156,060 |
| 2023 | $2,520 | $144,547 | $26,282 | $118,265 |
| 2022 | $2,781 | $141,969 | $15,018 | $126,951 |
| 2021 | $2,241 | $106,827 | $15,018 | $91,809 |
| 2020 | $2,159 | $100,898 | $15,018 | $85,880 |
| 2019 | $1,986 | $91,266 | $15,018 | $76,248 |
| 2018 | $1,796 | $82,555 | $15,018 | $67,537 |
| 2017 | $1,821 | $85,273 | $15,018 | $70,255 |
| 2016 | $1,692 | $79,249 | $15,018 | $64,231 |
| 2015 | $1,139 | $76,260 | $15,018 | $61,242 |
| 2014 | $1,139 | $72,956 | $15,018 | $57,938 |
Source: Public Records
Map
Nearby Homes
- 520 E Lake St
- 1015 S Donnybrook Ave
- 1212 Belmont Dr
- 319 E 1st St
- 128 Rowland Place
- 313 E Charnwood St
- 117 Rowland Place
- 145 Rowland Place
- 107 Rowland Place
- 114 E 2nd St
- 403 E Houston St
- 1118 S Fleishel Ave
- 204 Lindsey Ln
- 401 E 3rd St
- 1014 S College Ave
- 201 W Rusk St
- 210 Mockingbird Ln
- 937 Magnolia Dr
- 829 S College Ave
- 310 W Dobbs St
- 529 529 E Dodge
- 519 E Dodge St
- 601 E Dodge St
- 929 S Sneed Ave
- 929 929 S Sneed
- 517 E Dodge St
- 909 S Sneed Ave
- 511 511 E Dodge
- 511 E Dodge St
- 1002 S Sneed Ave
- 518 E Rix St
- 526 E Rix St
- 516 516 E Dodge
- 510 E Rix St
- 903 S Sneed Ave
- 509 E Dodge St
- 1006 S Sneed Ave
- 903 903 Sneed Ave
- 903 903 S Sneed
- 903 903 S Sneed
Your Personal Tour Guide
Ask me questions while you tour the home.