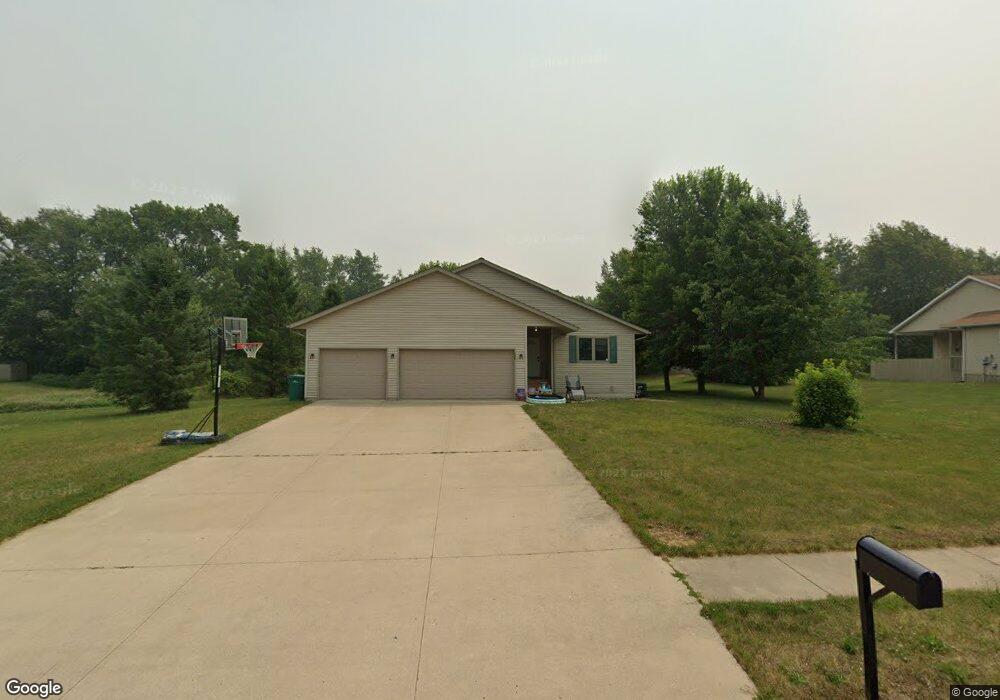
529 Filbert St New Carlisle, IN 46552
Estimated Value: $320,000 - $362,000
2
Beds
3
Baths
1,380
Sq Ft
$250/Sq Ft
Est. Value
About This Home
This home is located at 529 Filbert St, New Carlisle, IN 46552 and is currently estimated at $345,327, approximately $250 per square foot. 529 Filbert St is a home located in St. Joseph County with nearby schools including New Prairie High School.
Ownership History
Date
Name
Owned For
Owner Type
Purchase Details
Closed on
Nov 19, 2021
Sold by
Blackman Steven W
Bought by
Lawrence Jacob and Lawrence Albert F
Current Estimated Value
Home Financials for this Owner
Home Financials are based on the most recent Mortgage that was taken out on this home.
Original Mortgage
$200,000
Outstanding Balance
$183,418
Interest Rate
3.05%
Mortgage Type
New Conventional
Estimated Equity
$161,909
Purchase Details
Closed on
Nov 18, 2021
Sold by
Blackmun Steven W
Bought by
Lawrence Jacob and Lawrence Albert F
Home Financials for this Owner
Home Financials are based on the most recent Mortgage that was taken out on this home.
Original Mortgage
$200,000
Outstanding Balance
$183,418
Interest Rate
3.05%
Mortgage Type
New Conventional
Estimated Equity
$161,909
Purchase Details
Closed on
Mar 3, 2009
Sold by
Chapman Scott Glenn
Bought by
Blackmun Steven W
Home Financials for this Owner
Home Financials are based on the most recent Mortgage that was taken out on this home.
Original Mortgage
$165,750
Interest Rate
5.14%
Mortgage Type
FHA
Purchase Details
Closed on
Jan 24, 2006
Sold by
Chapman Jerry C
Bought by
Chapman Scott Glenn
Create a Home Valuation Report for This Property
The Home Valuation Report is an in-depth analysis detailing your home's value as well as a comparison with similar homes in the area
Home Values in the Area
Average Home Value in this Area
Purchase History
| Date | Buyer | Sale Price | Title Company |
|---|---|---|---|
| Lawrence Jacob | -- | None Available | |
| Lawrence Jacob | -- | Jaquinde William | |
| Blackmun Steven W | -- | Metropolitan Title In Llc | |
| Chapman Scott Glenn | -- | Merdian Title Corp |
Source: Public Records
Mortgage History
| Date | Status | Borrower | Loan Amount |
|---|---|---|---|
| Open | Lawrence Jacob | $200,000 | |
| Closed | Lawrence Jacob | $200,000 | |
| Previous Owner | Blackmun Steven W | $165,750 |
Source: Public Records
Tax History Compared to Growth
Tax History
| Year | Tax Paid | Tax Assessment Tax Assessment Total Assessment is a certain percentage of the fair market value that is determined by local assessors to be the total taxable value of land and additions on the property. | Land | Improvement |
|---|---|---|---|---|
| 2024 | $2,966 | $338,700 | $76,200 | $262,500 |
| 2023 | $2,916 | $259,100 | $76,200 | $182,900 |
| 2022 | $2,725 | $249,100 | $76,200 | $172,900 |
| 2021 | $2,040 | $186,200 | $34,900 | $151,300 |
| 2020 | $1,923 | $223,000 | $32,500 | $190,500 |
| 2019 | $1,843 | $166,500 | $23,800 | $142,700 |
| 2018 | $2,228 | $169,700 | $23,800 | $145,900 |
| 2017 | $2,325 | $168,000 | $23,800 | $144,200 |
| 2016 | $2,494 | $169,500 | $23,800 | $145,700 |
| 2014 | $2,205 | $171,500 | $23,800 | $147,700 |
Source: Public Records
Map
Nearby Homes
- 114 S Cherry St
- 710 Thunderbird Dr
- 732 W Michigan St
- 54654 Wintergreen Rd
- 750 W Michigan St
- 528 W Elm St
- 55330 Timothy Rd
- 33671 Woodmont Ridge Dr
- 54760 County Line Rd
- 33811 Ferncrest Ct
- 54850 County Line Rd
- 55420 County Line Rd
- 0 Wintergreen Rd
- 55420 Forest Cove Ct
- 55584 County Line Rd
- 55564 County Line Rd
- 55544 County Line Rd
- 55574 County Line Rd
- 55594 County Line Rd
- 33791 Early Rd
- 529 S Filbert St
- 525 Filbert St
- 0 Corner Filbert & Chapman Unit 417257
- 0 Corner Filbert & Chapman Unit 427069
- 0 Corner Filbert & Chapman Unit 201729020
- 0 Corner Filbert & Chapman Unit 202140279
- 0 Corner Filbert & Chapman Unit 501442
- 0 Corner Filbert & Chapman Unit 470876
- 0 Corner Filbert & Chapman Unit 202007407
- 0 Corner Filbert & Chapman Unit 201922801
- 0 Corner Filbert & Chapman Unit 456247
- 220 Chapman Rd
- 220 Chapman Rd Unit 801A
- 220 Chapman Rd Unit 801A
- 220 Chapman Rd Unit 801A
- 508 Filbert St
- 510 Filbert St
- 508 Filbert St
- 510 Filbert St
- 514 Filbert St