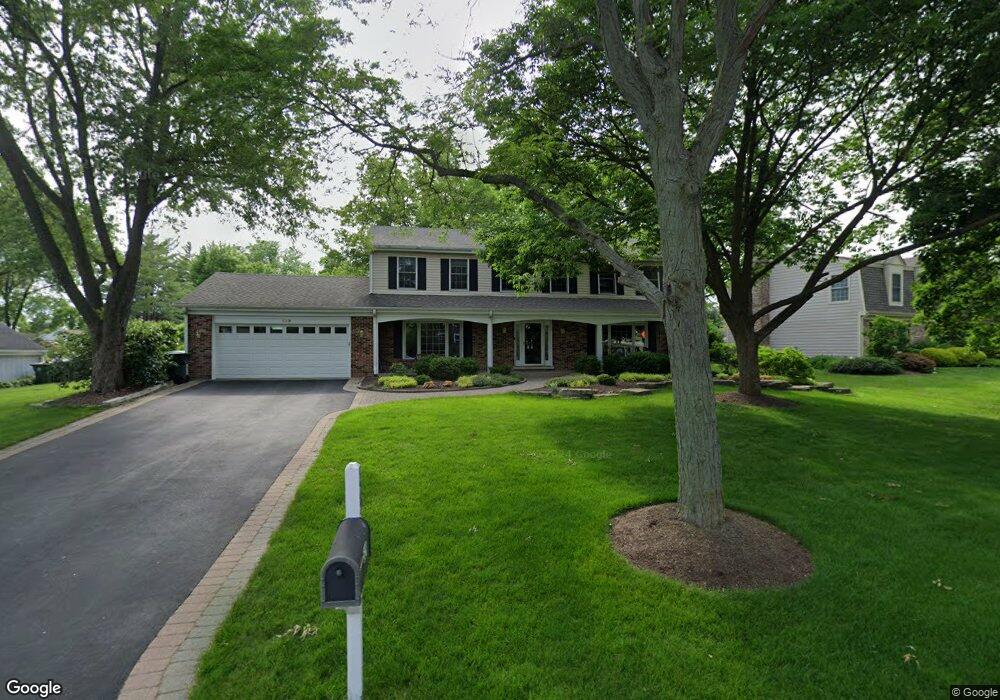
529 Fox Glove Ln Barrington, IL 60010
Estimated Value: $686,000 - $918,000
--
Bed
3
Baths
2,759
Sq Ft
$278/Sq Ft
Est. Value
About This Home
This home is located at 529 Fox Glove Ln, Barrington, IL 60010 and is currently estimated at $766,723, approximately $277 per square foot. 529 Fox Glove Ln is a home located in Lake County with nearby schools including Arnett C. Lines Elementary School, Barrington Middle School Station Campus, and Barrington High School.
Ownership History
Date
Name
Owned For
Owner Type
Purchase Details
Closed on
Aug 29, 2024
Sold by
Jennifer L Gardner Declaration Of Trust and Gardner Jennifer L
Bought by
Jeffrey R Gardner Declaration Of Trust
Current Estimated Value
Purchase Details
Closed on
Jun 17, 2024
Sold by
Gardner Jennifer L
Bought by
Gardner Jeffrey R
Purchase Details
Closed on
Jul 14, 2005
Sold by
Gardner Jeffrey R and Gardner Jennifer L
Bought by
Jennifer L Gardner Declaration Of Trust and Jeffrey R Gardner Declaration Of Trust
Purchase Details
Closed on
Mar 22, 2001
Sold by
Doering Rick H and Doering Cynthia L
Bought by
Gardner Jeffrey R and Gardner Jennifer L
Home Financials for this Owner
Home Financials are based on the most recent Mortgage that was taken out on this home.
Original Mortgage
$200,000
Interest Rate
7.02%
Create a Home Valuation Report for This Property
The Home Valuation Report is an in-depth analysis detailing your home's value as well as a comparison with similar homes in the area
Home Values in the Area
Average Home Value in this Area
Purchase History
| Date | Buyer | Sale Price | Title Company |
|---|---|---|---|
| Jeffrey R Gardner Declaration Of Trust | -- | None Listed On Document | |
| Gardner Jeffrey R | -- | None Listed On Document | |
| Jennifer L Gardner Declaration Of Trust | -- | None Available | |
| Gardner Jeffrey R | $474,000 | 1St American Title |
Source: Public Records
Mortgage History
| Date | Status | Borrower | Loan Amount |
|---|---|---|---|
| Previous Owner | Gardner Jeffrey R | $200,000 |
Source: Public Records
Tax History Compared to Growth
Tax History
| Year | Tax Paid | Tax Assessment Tax Assessment Total Assessment is a certain percentage of the fair market value that is determined by local assessors to be the total taxable value of land and additions on the property. | Land | Improvement |
|---|---|---|---|---|
| 2024 | $12,826 | $192,214 | $42,066 | $150,148 |
| 2023 | $12,826 | $187,051 | $40,936 | $146,115 |
| 2022 | $12,187 | $168,487 | $40,143 | $128,344 |
| 2021 | $11,931 | $164,169 | $39,114 | $125,055 |
| 2020 | $11,669 | $164,169 | $39,114 | $125,055 |
| 2019 | $11,423 | $162,737 | $38,773 | $123,964 |
| 2018 | $5,658 | $161,932 | $41,712 | $120,220 |
| 2017 | $11,166 | $159,980 | $41,209 | $118,771 |
| 2016 | $11,079 | $154,914 | $39,904 | $115,010 |
| 2015 | $10,637 | $147,551 | $38,007 | $109,544 |
| 2014 | $9,789 | $131,740 | $39,958 | $91,782 |
| 2012 | $10,356 | $132,017 | $40,042 | $91,975 |
Source: Public Records
Map
Nearby Homes
- 523 N Ela Rd
- 104 Lois Ln
- 1312 Lake Shore Dr N Unit 7
- 290 Cold Spring Rd
- 1288 The Point St
- 110 Tudor Dr
- 185 Cold Spring Rd
- 101 Surrey Ln
- 104 Howe Terrace
- 44 Oak Ridge Ln
- 175 Hilltop Ave
- 248 Beverly Rd
- 117 Beverly Rd
- 36 Ferndale Rd
- 216 Beverly Rd
- 20633 N Primrose Ct
- 21 Ferndale Rd
- 432 Whitney Dr
- 23036 W Long Grove Rd
- 1010 Oakland Dr
- 527 Fox Glove Ln
- 531 Fox Glove Ln
- 525 Fox Glove Ln
- 520 Lake Shore Dr N
- 518 Lake Shore Dr N
- 533 Fox Glove Ln
- 539 Fox Glove Ln
- 516 Lake Shore Dr N
- 526 Fox Glove Ln
- 522 Lake Shore Dr N
- LOT 10 Foxglove Ln
- LOT 8 Fox Glove Ln
- LOT 9 Foxglove Ln
- LOT 9 Fox Glove Ln
- 437 Fox Glove Ln
- 524 Fox Glove Ln
- 536 Fox Glove Ln
- 524 Lake Shore Dr N
- 541 Fox Glove Ln
- 538 Fox Glove Ln