529 Lime Kiln Rd Ringgold, GA 30736
Graysville NeighborhoodEstimated Value: $385,000 - $528,923
--
Bed
2
Baths
1,736
Sq Ft
$254/Sq Ft
Est. Value
About This Home
This home is located at 529 Lime Kiln Rd, Ringgold, GA 30736 and is currently estimated at $441,641, approximately $254 per square foot. 529 Lime Kiln Rd is a home located in Catoosa County with nearby schools including Graysville Elementary School, Ringgold Middle School, and Ringgold High School.
Ownership History
Date
Name
Owned For
Owner Type
Purchase Details
Closed on
Dec 6, 2024
Sold by
Mashburn Robert Lee
Bought by
Robert L Mashburn Revocable Trust
Current Estimated Value
Purchase Details
Closed on
Mar 2, 2016
Sold by
Daniels Jerry L
Bought by
Mashburn Robert Lee
Purchase Details
Closed on
Nov 19, 2012
Sold by
Daniels Jerry L
Bought by
Lj Investment Holdings Llc
Purchase Details
Closed on
Mar 22, 2010
Sold by
Tennessee Lookout Llp
Bought by
Daniels Jerry L
Purchase Details
Closed on
Sep 1, 2009
Sold by
Blackwell Charissa A
Bought by
Tennessee Lookout Llp
Purchase Details
Closed on
Aug 16, 2006
Sold by
Blackwell Charissa
Bought by
Blackwell Charissa
Home Financials for this Owner
Home Financials are based on the most recent Mortgage that was taken out on this home.
Original Mortgage
$135,000
Interest Rate
6.73%
Mortgage Type
New Conventional
Purchase Details
Closed on
Oct 6, 1997
Bought by
Blackwell Charissa A
Create a Home Valuation Report for This Property
The Home Valuation Report is an in-depth analysis detailing your home's value as well as a comparison with similar homes in the area
Home Values in the Area
Average Home Value in this Area
Purchase History
| Date | Buyer | Sale Price | Title Company |
|---|---|---|---|
| Robert L Mashburn Revocable Trust | -- | -- | |
| Mashburn Robert Lee | $365,000 | -- | |
| Lj Investment Holdings Llc | $25,000 | -- | |
| Daniels Jerry L | $175,000 | -- | |
| Daniels Jerry L | $175,000 | -- | |
| Tennessee Lookout Llp | -- | -- | |
| Blackwell Charissa | -- | -- | |
| Blackwell Charissa A | -- | -- |
Source: Public Records
Mortgage History
| Date | Status | Borrower | Loan Amount |
|---|---|---|---|
| Previous Owner | Blackwell Charissa | $135,000 |
Source: Public Records
Tax History Compared to Growth
Tax History
| Year | Tax Paid | Tax Assessment Tax Assessment Total Assessment is a certain percentage of the fair market value that is determined by local assessors to be the total taxable value of land and additions on the property. | Land | Improvement |
|---|---|---|---|---|
| 2024 | $3,774 | $176,941 | $74,399 | $102,542 |
| 2023 | $3,444 | $153,830 | $74,399 | $79,431 |
| 2022 | $3,089 | $137,983 | $74,399 | $63,584 |
| 2021 | $2,887 | $137,983 | $74,399 | $63,584 |
| 2020 | $2,710 | $117,123 | $61,552 | $55,571 |
| 2019 | $2,739 | $117,123 | $61,552 | $55,571 |
| 2018 | $2,894 | $117,123 | $61,552 | $55,571 |
| 2017 | $2,200 | $89,042 | $61,552 | $27,490 |
| 2016 | $2,342 | $90,135 | $61,707 | $28,428 |
| 2015 | -- | $80,878 | $52,449 | $28,429 |
| 2014 | -- | $65,339 | $42,826 | $22,514 |
| 2013 | -- | $74,123 | $51,609 | $22,513 |
Source: Public Records
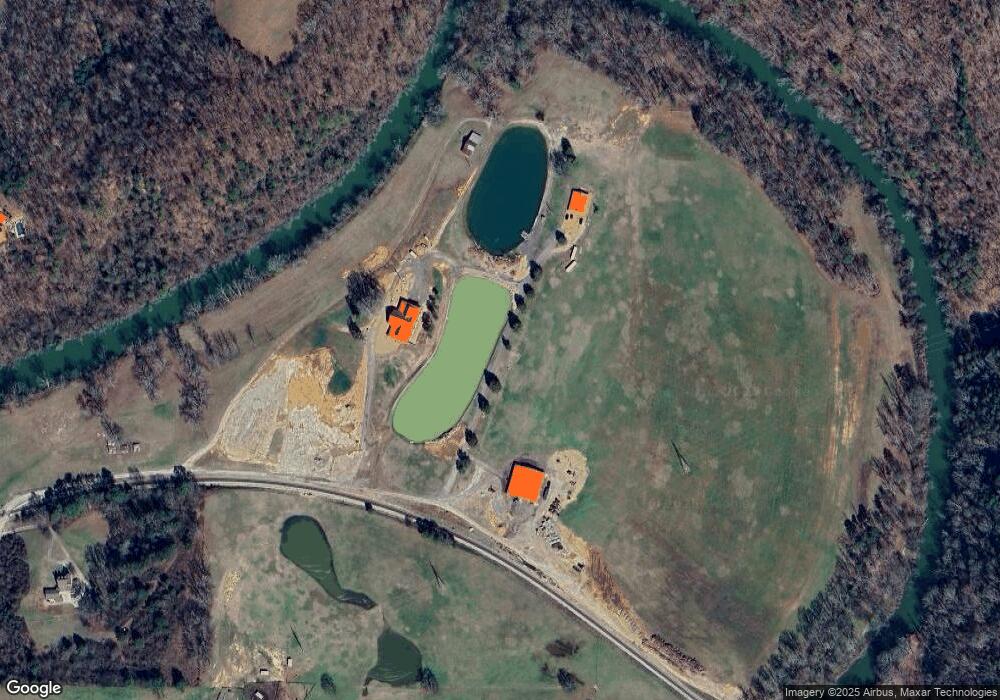
Map
Nearby Homes
- 212 Cleo Cir
- 1926 Windstone Dr
- 61 Hugo Dr
- 1768 Windstone Dr
- 750 Dug Rd
- 40 Sonoma Ln
- 51 Grove St
- 293 Blue Jay Pkwy
- 1572 Windstone Dr
- 225 Blue Jay Pkwy
- 159 Manor Dr
- 70 Castleview Dr
- 801 Susan Carol Ln
- 0 Saunders Rd Unit 1514876
- 8807 Hurricane Manor Trail
- 804 Amy Ln
- 801 Chestnut Wood Ln
- 0 Blue Jay Pkwy Unit 1517991
- 0 Blue Jay Pkwy Unit 10577001
- 8727 Hurricane Manor Trail
- 1019 Dug Rd
- 2755 Swanson Rd
- 2689 Swanson Rd
- 282 Lime Kiln Rd
- Lot 29 A&B Swanson Rd
- 000 Swanson Rd
- 00 Swanson Rd
- 000 Swanson Rd Unit 1
- 00 Swanson Rd Unit 1
- 1020 Dug Rd
- 3081 Swanson Rd
- 2440 Swanson Rd
- 2586 Swanson Rd
- 2704 Swanson Rd
- 2996 Swanson Rd
- 2536 Swanson Rd
- 3093 Swanson Rd
- 2485 Swanson Rd
- 158 Lime Kiln Rd
- 181 Lime Kiln Rd