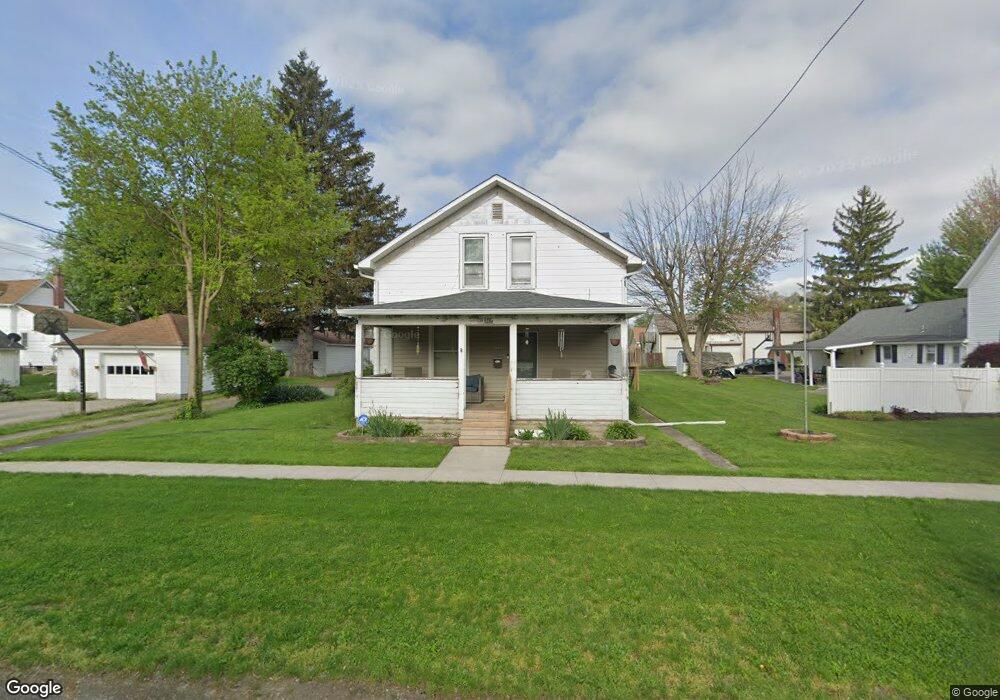
529 Moening St Delphos, OH 45833
Estimated Value: $108,000 - $142,000
4
Beds
2
Baths
1,872
Sq Ft
$63/Sq Ft
Est. Value
About This Home
This home is located at 529 Moening St, Delphos, OH 45833 and is currently estimated at $118,418, approximately $63 per square foot. 529 Moening St is a home located in Allen County with nearby schools including Delphos St. John's High School and Delphos St. John's Elementary School.
Ownership History
Date
Name
Owned For
Owner Type
Purchase Details
Closed on
Feb 15, 2022
Sold by
Baldauf Properties Llc
Bought by
Baker Harold Eugene
Current Estimated Value
Home Financials for this Owner
Home Financials are based on the most recent Mortgage that was taken out on this home.
Original Mortgage
$29,400
Interest Rate
3.55%
Mortgage Type
New Conventional
Purchase Details
Closed on
Sep 23, 2013
Sold by
Finn Lisa and Baldauf Ronald
Bought by
Baldauf Properties Llc
Purchase Details
Closed on
Sep 15, 2011
Sold by
Cress Virginia
Bought by
Baldauf Ronald and Finn Lisa
Purchase Details
Closed on
Mar 17, 2010
Sold by
Baldauf Michael and Baldauf Lori
Bought by
Cress Virginia and Baldauf Ronald
Purchase Details
Closed on
Aug 6, 2007
Sold by
Baldauf Ruth M and Liebrecht Ruth
Bought by
Cress Virginia and Baldauf Michael
Purchase Details
Closed on
Mar 18, 1992
Bought by
Baldauf John F
Create a Home Valuation Report for This Property
The Home Valuation Report is an in-depth analysis detailing your home's value as well as a comparison with similar homes in the area
Home Values in the Area
Average Home Value in this Area
Purchase History
| Date | Buyer | Sale Price | Title Company |
|---|---|---|---|
| Baker Harold Eugene | $40,000 | Brock T Blain | |
| Baldauf Properties Llc | -- | None Available | |
| Baldauf Ronald | -- | None Available | |
| Cress Virginia | -- | Attorney | |
| Cress Virginia | -- | None Available | |
| Baldauf John F | $25,000 | -- |
Source: Public Records
Mortgage History
| Date | Status | Borrower | Loan Amount |
|---|---|---|---|
| Previous Owner | Baker Harold Eugene | $29,400 |
Source: Public Records
Tax History
| Year | Tax Paid | Tax Assessment Tax Assessment Total Assessment is a certain percentage of the fair market value that is determined by local assessors to be the total taxable value of land and additions on the property. | Land | Improvement |
|---|---|---|---|---|
| 2024 | $754 | $33,530 | $7,700 | $25,830 |
| 2023 | $539 | $25,030 | $5,740 | $19,290 |
| 2022 | $545 | $24,400 | $5,740 | $18,660 |
| 2021 | $397 | $19,780 | $5,740 | $14,040 |
| 2020 | $192 | $16,670 | $5,500 | $11,170 |
| 2019 | $192 | $14,360 | $5,500 | $8,860 |
| 2018 | $773 | $23,630 | $5,500 | $18,130 |
| 2017 | $738 | $21,990 | $5,500 | $16,490 |
| 2016 | $752 | $21,990 | $5,500 | $16,490 |
| 2015 | $845 | $21,990 | $5,500 | $16,490 |
| 2014 | $845 | $24,860 | $5,290 | $19,570 |
| 2013 | $850 | $24,860 | $5,290 | $19,570 |
Source: Public Records
Map
Nearby Homes
Your Personal Tour Guide
Ask me questions while you tour the home.