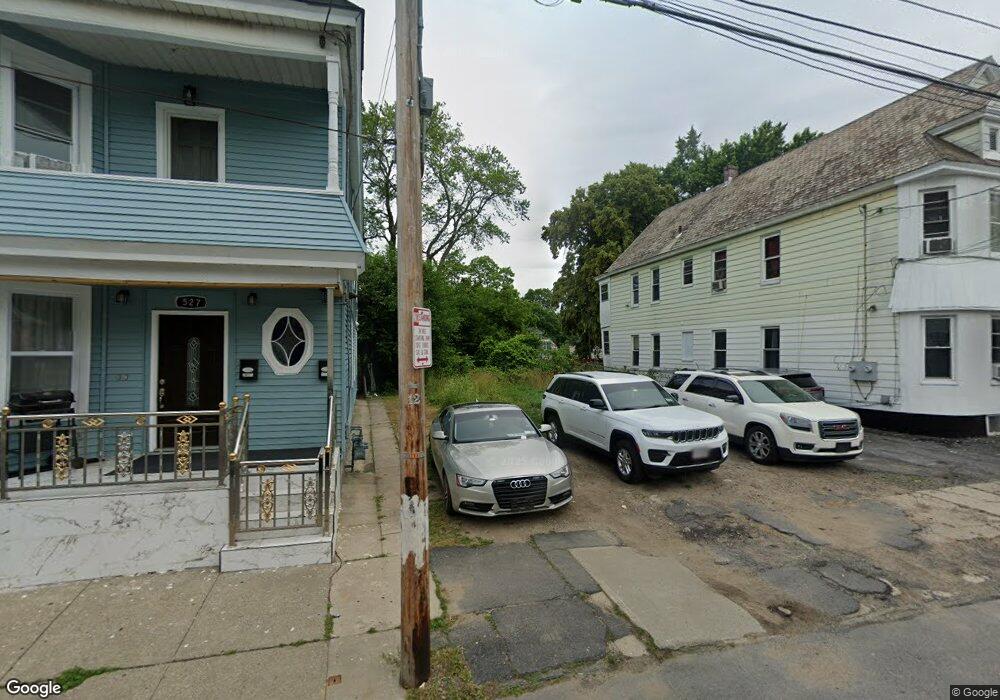
529 Mumford St Schenectady, NY 12307
Hamilton Hill NeighborhoodEstimated Value: $23,315 - $248,000
6
Beds
2
Baths
2,014
Sq Ft
$67/Sq Ft
Est. Value
About This Home
This home is located at 529 Mumford St, Schenectady, NY 12307 and is currently estimated at $134,329, approximately $66 per square foot. 529 Mumford St is a home located in Schenectady County with nearby schools including Van Corlaer Elementary School, Mont Pleasant Middle School, and Schenectady High School.
Ownership History
Date
Name
Owned For
Owner Type
Purchase Details
Closed on
May 5, 2023
Sold by
Ferrari Anthony
Bought by
City Of Schenectady
Current Estimated Value
Purchase Details
Closed on
Feb 27, 2015
Sold by
The City Of Schenectady
Bought by
The Schenectady Urban Renewal Agency
Purchase Details
Closed on
Aug 12, 2014
Sold by
Brown Johnny
Bought by
The City Of Schenectady
Purchase Details
Closed on
Feb 28, 2013
Sold by
Degenova Deborah W
Bought by
The City Of Schenectady
Purchase Details
Closed on
Jan 29, 2007
Sold by
Estate Pittman Curlen
Bought by
Persaud Maniram
Home Financials for this Owner
Home Financials are based on the most recent Mortgage that was taken out on this home.
Original Mortgage
$8,000
Interest Rate
5%
Mortgage Type
Purchase Money Mortgage
Create a Home Valuation Report for This Property
The Home Valuation Report is an in-depth analysis detailing your home's value as well as a comparison with similar homes in the area
Home Values in the Area
Average Home Value in this Area
Purchase History
| Date | Buyer | Sale Price | Title Company |
|---|---|---|---|
| City Of Schenectady | -- | None Listed On Document | |
| City Of Schenectady | -- | None Listed On Document | |
| The Schenectady Urban Renewal Agency | $500 | None Available | |
| The City Of Schenectady | $500 | None Available | |
| The City Of Schenectady | -- | None Available | |
| Persaud Maniram | $25,000 | C Frinks Dixon |
Source: Public Records
Mortgage History
| Date | Status | Borrower | Loan Amount |
|---|---|---|---|
| Previous Owner | Persaud Maniram | $8,000 |
Source: Public Records
Tax History Compared to Growth
Tax History
| Year | Tax Paid | Tax Assessment Tax Assessment Total Assessment is a certain percentage of the fair market value that is determined by local assessors to be the total taxable value of land and additions on the property. | Land | Improvement |
|---|---|---|---|---|
| 2024 | $906 | $7,700 | $7,700 | $0 |
| 2023 | $906 | $7,700 | $7,700 | $0 |
| 2022 | $906 | $7,700 | $7,700 | $0 |
| 2021 | $226 | $7,700 | $7,700 | $0 |
| 2020 | $906 | $14,956 | $6,900 | $8,056 |
| 2019 | $906 | $14,956 | $6,900 | $8,056 |
| 2018 | $906 | $14,956 | $6,900 | $8,056 |
| 2017 | -- | $14,956 | $6,900 | $8,056 |
| 2016 | $872 | $14,956 | $6,900 | $8,056 |
| 2015 | -- | $14,956 | $6,900 | $8,056 |
| 2014 | -- | $14,956 | $6,900 | $8,056 |
Source: Public Records
Map
Nearby Homes