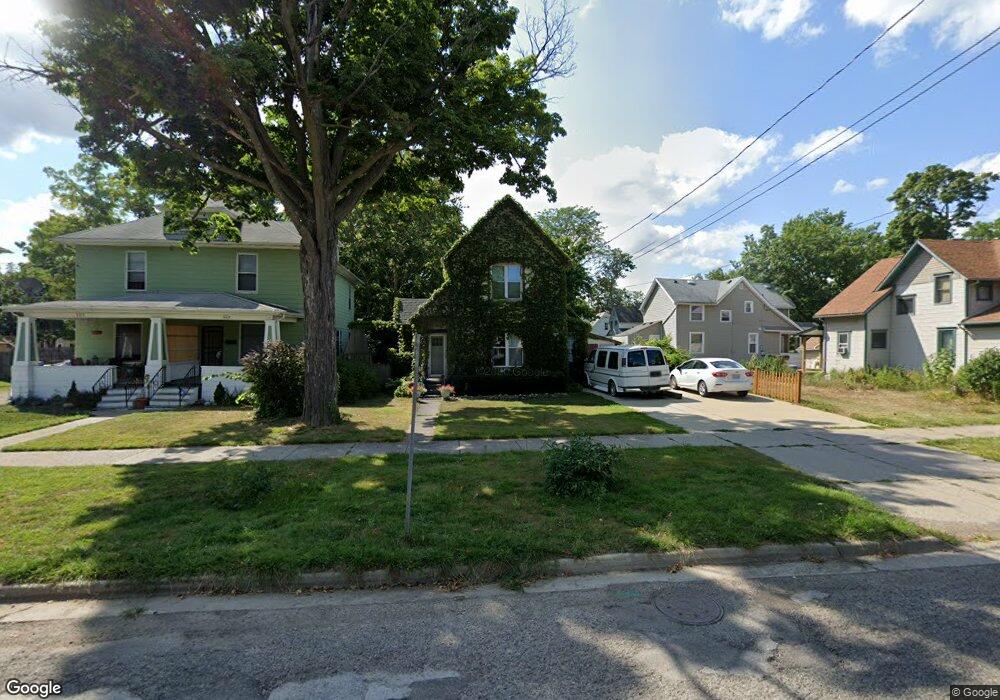
529 N Walnut St Lansing, MI 48933
Downtown Lansing NeighborhoodEstimated Value: $140,000 - $177,000
Studio
2
Baths
1,655
Sq Ft
$99/Sq Ft
Est. Value
About This Home
This home is located at 529 N Walnut St, Lansing, MI 48933 and is currently estimated at $163,166, approximately $98 per square foot. 529 N Walnut St is a home located in Ingham County with nearby schools including Riddle Elementary School, Pattengill Academy, and J.W. Sexton High School.
Ownership History
Date
Name
Owned For
Owner Type
Purchase Details
Closed on
Sep 9, 2021
Sold by
Parpich Mark T
Bought by
Pangbom Courtney L
Current Estimated Value
Home Financials for this Owner
Home Financials are based on the most recent Mortgage that was taken out on this home.
Original Mortgage
$86,800
Outstanding Balance
$78,982
Interest Rate
2.8%
Mortgage Type
New Conventional
Estimated Equity
$84,184
Purchase Details
Closed on
Aug 30, 2001
Sold by
Ward Robert J and Ward Danette
Bought by
Perpich Mark T and Pangborn Courtney L
Home Financials for this Owner
Home Financials are based on the most recent Mortgage that was taken out on this home.
Original Mortgage
$69,702
Interest Rate
6.99%
Mortgage Type
FHA
Purchase Details
Closed on
Jan 28, 2001
Sold by
Zizka Lucy
Bought by
Ward Robert J
Purchase Details
Closed on
May 21, 1992
Sold by
Ward Virginia A
Bought by
Ward Robert J
Purchase Details
Closed on
Mar 30, 1989
Sold by
Lowers Eber I and Lowers Tanya
Bought by
Ward Robert J and Ward Virginia
Create a Home Valuation Report for This Property
The Home Valuation Report is an in-depth analysis detailing your home's value as well as a comparison with similar homes in the area
Home Values in the Area
Average Home Value in this Area
Purchase History
| Date | Buyer | Sale Price | Title Company |
|---|---|---|---|
| Pangbom Courtney L | -- | Liberty Title | |
| Perpich Mark T | $64,000 | -- | |
| Ward Robert J | -- | -- | |
| Ward Robert J | -- | -- | |
| Ward Robert J | $6,000 | -- |
Source: Public Records
Mortgage History
| Date | Status | Borrower | Loan Amount |
|---|---|---|---|
| Open | Pangbom Courtney L | $86,800 | |
| Previous Owner | Perpich Mark T | $69,702 |
Source: Public Records
Tax History
| Year | Tax Paid | Tax Assessment Tax Assessment Total Assessment is a certain percentage of the fair market value that is determined by local assessors to be the total taxable value of land and additions on the property. | Land | Improvement |
|---|---|---|---|---|
| 2025 | $3,995 | $75,500 | $7,500 | $68,000 |
| 2024 | $32 | $71,700 | $7,500 | $64,200 |
| 2023 | $3,757 | $64,800 | $7,500 | $57,300 |
| 2022 | $3,417 | $57,100 | $6,800 | $50,300 |
| 2021 | $3,342 | $54,500 | $7,500 | $47,000 |
| 2020 | $3,319 | $50,900 | $7,500 | $43,400 |
| 2019 | $3,192 | $46,200 | $7,500 | $38,700 |
| 2018 | $3,015 | $44,500 | $7,500 | $37,000 |
| 2017 | $2,894 | $44,500 | $7,500 | $37,000 |
| 2016 | $2,774 | $43,700 | $7,500 | $36,200 |
| 2015 | $2,774 | $42,500 | $15,000 | $27,500 |
| 2014 | $2,774 | $41,100 | $19,500 | $21,600 |
Source: Public Records
Map
Nearby Homes
- 612 N Walnut St
- 312 W Saginaw St Unit 1
- 309 W Lapeer St
- 514 N Walnut St
- 733 N Walnut St
- 809 Seymour Ave
- 821 N Chestnut St
- 908 N Walnut St
- 908 N Capitol Ave
- 420 W Ionia St
- 920 N Capitol Ave Unit 1
- 425 N Sycamore St
- 925 N Pine St
- 411 W Ionia St
- 904 N Sycamore St
- 610 Bluff St
- 1023 Seymour Ave
- 1 N Grand Ave
- 325 N Sycamore St
- 921 N Sycamore St
- 523 N Walnut St
- 409 W Lapeer St Unit 1
- 535 N Walnut St
- 413 W Lapeer St
- 521 N Walnut St
- 417 W Lapeer St
- 423 W Lapeer St
- 522 N Chestnut St
- 524 N Chestnut St
- 518 N Chestnut St
- 509 N Walnut St Unit 1
- 516 N Chestnut St
- 524 N Walnut St
- 528 N Walnut St
- 522 N Walnut St
- 522 N Walnut St Unit Lower
- 408 W Lapeer St
- 534 N Chestnut St
- 410 W Lapeer St
- 410 W Lapeer St Unit Lower
Your Personal Tour Guide
Ask me questions while you tour the home.