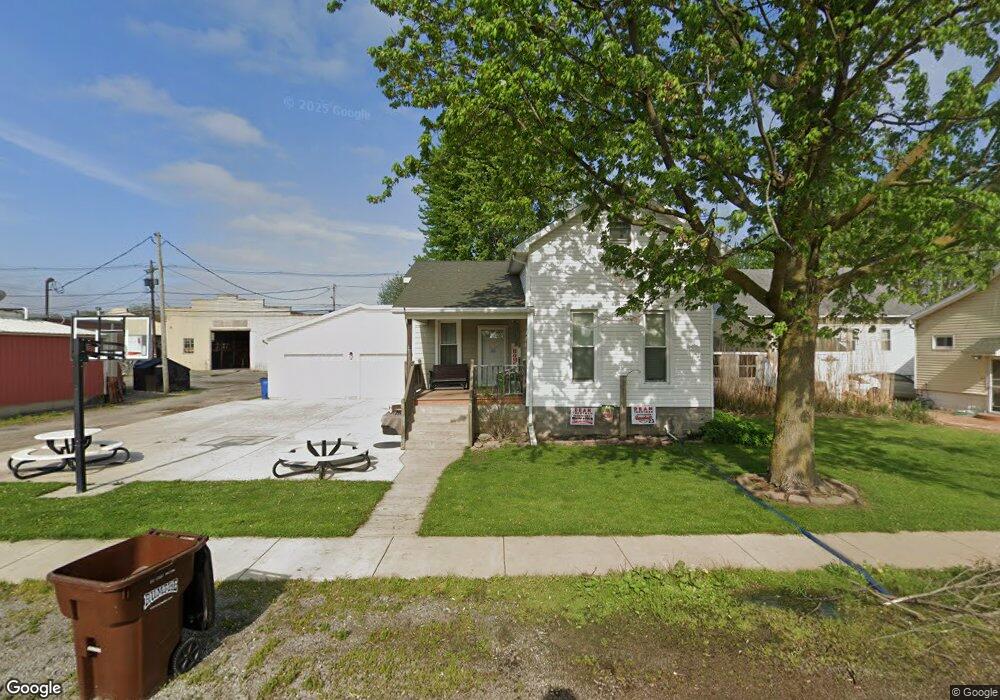
529 N Washington St Delphos, OH 45833
Estimated Value: $140,000 - $184,000
4
Beds
2
Baths
1,595
Sq Ft
$96/Sq Ft
Est. Value
About This Home
This home is located at 529 N Washington St, Delphos, OH 45833 and is currently estimated at $153,855, approximately $96 per square foot. 529 N Washington St is a home located in Allen County with nearby schools including Delphos St. John's High School and Delphos St. John's Elementary School.
Ownership History
Date
Name
Owned For
Owner Type
Purchase Details
Closed on
Apr 14, 2018
Sold by
Hoehn Roy V and Hoehn Lisa
Bought by
Trentman Terry M and Trentman Brandi S
Current Estimated Value
Home Financials for this Owner
Home Financials are based on the most recent Mortgage that was taken out on this home.
Original Mortgage
$124,500
Outstanding Balance
$107,827
Interest Rate
4.75%
Mortgage Type
Adjustable Rate Mortgage/ARM
Estimated Equity
$46,028
Purchase Details
Closed on
Mar 29, 2007
Sold by
Hoehn Gerald O and Hoehn Shirley A
Bought by
Hoehn Ashley N
Purchase Details
Closed on
Aug 11, 1992
Bought by
Hoehn Gerald O
Create a Home Valuation Report for This Property
The Home Valuation Report is an in-depth analysis detailing your home's value as well as a comparison with similar homes in the area
Home Values in the Area
Average Home Value in this Area
Purchase History
| Date | Buyer | Sale Price | Title Company |
|---|---|---|---|
| Trentman Terry M | $73,000 | None Available | |
| Hoehn Ashley N | $15,000 | None Available | |
| Hoehn Gerald O | $22,000 | -- |
Source: Public Records
Mortgage History
| Date | Status | Borrower | Loan Amount |
|---|---|---|---|
| Open | Trentman Terry M | $124,500 |
Source: Public Records
Tax History Compared to Growth
Tax History
| Year | Tax Paid | Tax Assessment Tax Assessment Total Assessment is a certain percentage of the fair market value that is determined by local assessors to be the total taxable value of land and additions on the property. | Land | Improvement |
|---|---|---|---|---|
| 2024 | $1,148 | $37,000 | $7,180 | $29,820 |
| 2023 | $907 | $27,620 | $5,360 | $22,260 |
| 2022 | $929 | $27,620 | $5,360 | $22,260 |
| 2021 | $936 | $27,620 | $5,360 | $22,260 |
| 2020 | $838 | $26,110 | $5,110 | $21,000 |
| 2019 | $838 | $26,110 | $5,110 | $21,000 |
| 2018 | $900 | $26,110 | $5,110 | $21,000 |
| 2017 | $811 | $24,190 | $5,110 | $19,080 |
| 2016 | $825 | $24,190 | $5,110 | $19,080 |
| 2015 | $849 | $24,190 | $5,110 | $19,080 |
| 2014 | $849 | $24,990 | $4,900 | $20,090 |
| 2013 | $763 | $22,300 | $4,900 | $17,400 |
Source: Public Records
Map
Nearby Homes