529 Reid Chapman Rd Murrayville, GA 30564
Murrayville NeighborhoodEstimated Value: $354,000 - $396,000
--
Bed
2
Baths
2,144
Sq Ft
$175/Sq Ft
Est. Value
About This Home
This home is located at 529 Reid Chapman Rd, Murrayville, GA 30564 and is currently estimated at $375,942, approximately $175 per square foot. 529 Reid Chapman Rd is a home located in Lumpkin County with nearby schools including Lumpkin County High School.
Ownership History
Date
Name
Owned For
Owner Type
Purchase Details
Closed on
Oct 15, 2024
Sold by
Black Eddie Dean
Bought by
Chapman Tommy
Current Estimated Value
Purchase Details
Closed on
Apr 3, 2023
Sold by
Walker Joy Denise
Bought by
Chapman Tommy
Purchase Details
Closed on
Mar 31, 2023
Sold by
Chapman Randall Chama
Bought by
Black Maggie Lavonda Chapman Estate and Walker Joy Denise
Purchase Details
Closed on
Jul 17, 1991
Sold by
Black Eddie D
Bought by
Black Eddie D
Purchase Details
Closed on
May 1, 1975
Bought by
Black Eddie D
Create a Home Valuation Report for This Property
The Home Valuation Report is an in-depth analysis detailing your home's value as well as a comparison with similar homes in the area
Home Values in the Area
Average Home Value in this Area
Purchase History
| Date | Buyer | Sale Price | Title Company |
|---|---|---|---|
| Chapman Tommy | -- | -- | |
| Black Eddie Dean | -- | -- | |
| Chapman Tommy | $300,000 | -- | |
| Black Eddie Dean Estate | -- | -- | |
| Black Maggie Lavonda Chapman Estate | -- | -- | |
| Black Maggie Lavonda Chapman Estate | -- | -- | |
| Black Eddie D | -- | -- | |
| Black Eddie D | -- | -- |
Source: Public Records
Tax History Compared to Growth
Tax History
| Year | Tax Paid | Tax Assessment Tax Assessment Total Assessment is a certain percentage of the fair market value that is determined by local assessors to be the total taxable value of land and additions on the property. | Land | Improvement |
|---|---|---|---|---|
| 2024 | $825 | $121,838 | $98,946 | $22,892 |
| 2023 | $1,184 | $123,566 | $85,419 | $38,147 |
| 2022 | $3,924 | $158,509 | $79,171 | $79,338 |
| 2021 | $4,327 | $152,519 | $79,171 | $73,348 |
| 2020 | $4,298 | $151,478 | $79,171 | $72,307 |
| 2019 | $4,298 | $151,478 | $79,171 | $72,307 |
| 2018 | $4,192 | $147,745 | $79,171 | $68,574 |
| 2017 | $0 | $149,011 | $79,171 | $69,840 |
| 2016 | $1,061 | $145,007 | $79,171 | $65,836 |
| 2015 | $922 | $145,007 | $79,171 | $65,836 |
| 2014 | $922 | $145,772 | $79,171 | $66,600 |
| 2013 | -- | $146,137 | $79,171 | $66,966 |
Source: Public Records
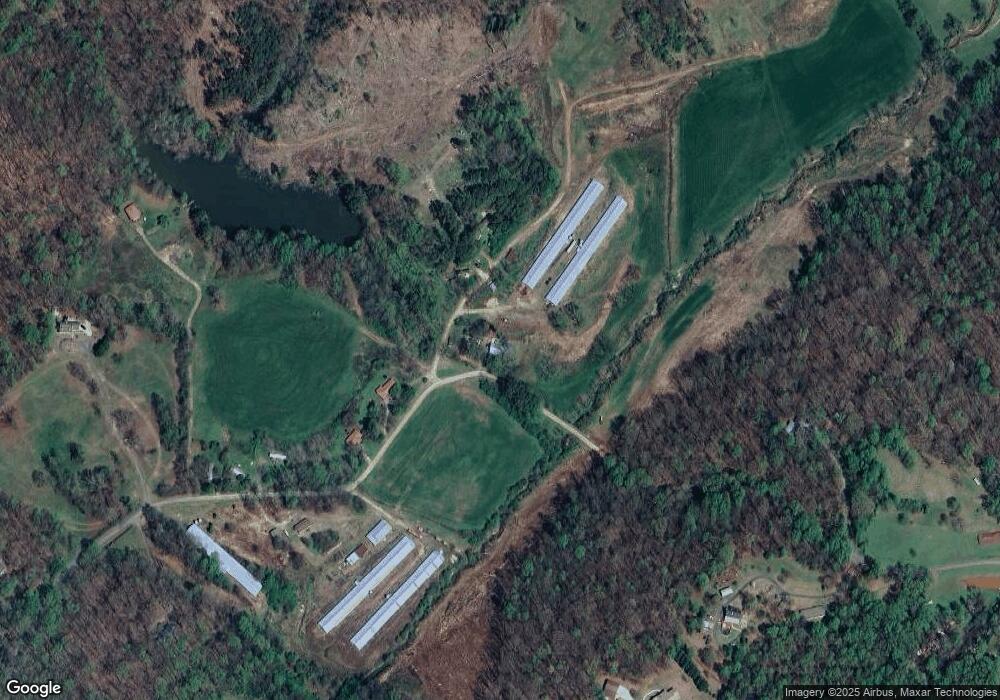
Map
Nearby Homes
- 12 Katydid Ln
- 600 Chapman Ridge Ln
- 500 Chapman Ridge Ln
- 27.68 Chapman Ridge Ln
- 20.65 Acres Mincie Mountain
- 42.65 Acres Mincie Mountain
- 23.86 Acres Mincie Mountain
- 6.2 Mincey Acres Dr
- 3.65AC Emory Stephens Rd
- 3.65 Ac Emory Stephens Rd
- 6480 Highway 52 W
- 86.99 Acres Mincie Mountain
- 220 Foothills Dr
- 1320 Claude Parks Rd
- 455 Reid Chapman Rd
- 439 Reid Chapman Rd
- 0 Amanda Dr Unit 7593390
- 0 Amanda Dr Unit 7504901
- 0 Amanda Dr Unit 7398383
- 0 Amanda Dr
- 335 Reid Chapman Rd
- 797 Reid Chapman Rd
- 798 Reid Chapman Rd
- 433 Amanda Dr
- 186 Jennifer Ln
- 287 Reid Chapman Rd
- 284 Reid Chapman Rd
- 126 Jennifer Ln
- 0 Reid Chapman Rd Unit 8243553
- 0 Reid Chapman Rd Unit 7494422
- 3 Jennifer Ln
- 472 Amanda Dr
- 169 Reid Chapman Rd
- 927 Reid Chapman Rd