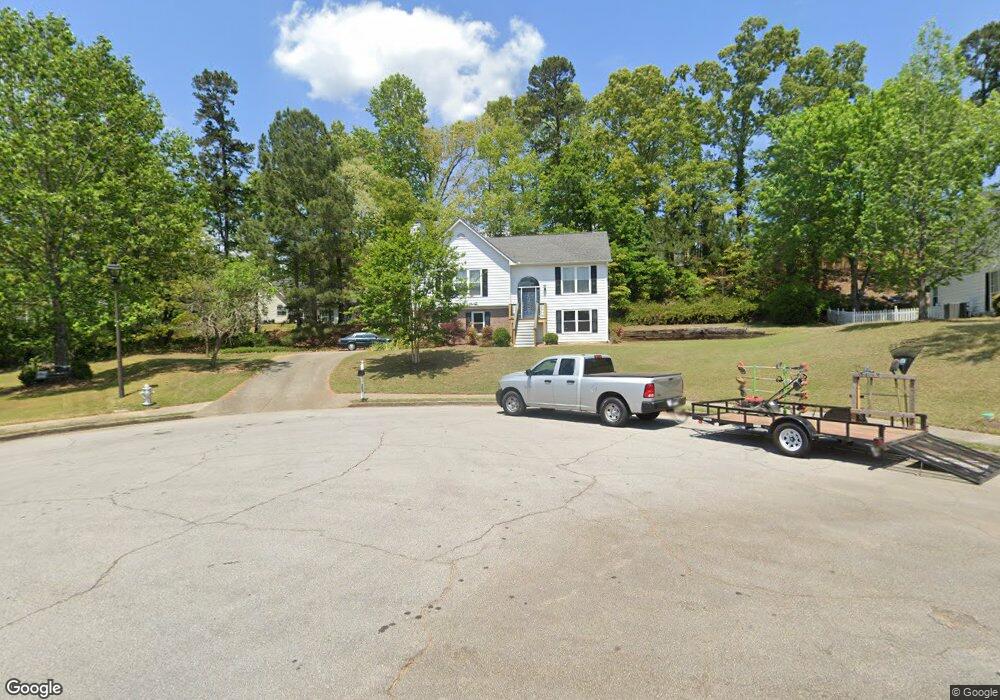
529 Running Doe Ct Suwanee, GA 30024
Estimated Value: $386,000 - $462,000
3
Beds
3
Baths
1,030
Sq Ft
$402/Sq Ft
Est. Value
About This Home
This home is located at 529 Running Doe Ct, Suwanee, GA 30024 and is currently estimated at $413,652, approximately $401 per square foot. 529 Running Doe Ct is a home located in Gwinnett County with nearby schools including Riverside Elementary School, North Gwinnett Middle School, and North Gwinnett High School.
Ownership History
Date
Name
Owned For
Owner Type
Purchase Details
Closed on
Nov 2, 2007
Sold by
Rice Sheree T
Bought by
Varrasso Joseph A
Current Estimated Value
Home Financials for this Owner
Home Financials are based on the most recent Mortgage that was taken out on this home.
Original Mortgage
$145,600
Outstanding Balance
$91,234
Interest Rate
6.37%
Mortgage Type
New Conventional
Estimated Equity
$322,418
Purchase Details
Closed on
Sep 27, 2002
Sold by
Hogan Charles R
Bought by
Rice Sheree T
Home Financials for this Owner
Home Financials are based on the most recent Mortgage that was taken out on this home.
Original Mortgage
$144,400
Interest Rate
6.18%
Mortgage Type
New Conventional
Purchase Details
Closed on
Jul 11, 1997
Sold by
Stick Builders Inc
Bought by
Hogan Charles R and Hogan Veronica E
Home Financials for this Owner
Home Financials are based on the most recent Mortgage that was taken out on this home.
Original Mortgage
$104,500
Interest Rate
7.37%
Mortgage Type
New Conventional
Create a Home Valuation Report for This Property
The Home Valuation Report is an in-depth analysis detailing your home's value as well as a comparison with similar homes in the area
Home Values in the Area
Average Home Value in this Area
Purchase History
| Date | Buyer | Sale Price | Title Company |
|---|---|---|---|
| Varrasso Joseph A | $182,000 | -- | |
| Rice Sheree T | $152,000 | -- | |
| Hogan Charles R | $110,100 | -- |
Source: Public Records
Mortgage History
| Date | Status | Borrower | Loan Amount |
|---|---|---|---|
| Open | Varrasso Joseph A | $145,600 | |
| Previous Owner | Rice Sheree T | $144,400 | |
| Previous Owner | Hogan Charles R | $104,500 |
Source: Public Records
Tax History
| Year | Tax Paid | Tax Assessment Tax Assessment Total Assessment is a certain percentage of the fair market value that is determined by local assessors to be the total taxable value of land and additions on the property. | Land | Improvement |
|---|---|---|---|---|
| 2025 | $3,717 | $133,480 | $38,000 | $95,480 |
| 2024 | $4,030 | $142,800 | $40,000 | $102,800 |
| 2023 | $4,030 | $147,160 | $40,000 | $107,160 |
| 2022 | $3,741 | $130,520 | $33,200 | $97,320 |
| 2021 | $2,909 | $88,560 | $23,280 | $65,280 |
| 2020 | $2,929 | $88,560 | $23,280 | $65,280 |
| 2019 | $2,664 | $79,960 | $20,000 | $59,960 |
| 2018 | $2,664 | $79,960 | $20,000 | $59,960 |
| 2016 | $2,461 | $69,600 | $23,600 | $46,000 |
| 2015 | $2,228 | $59,120 | $18,400 | $40,720 |
| 2014 | $2,058 | $54,080 | $16,400 | $37,680 |
Source: Public Records
Map
Nearby Homes
- 510 Running Fawn Dr
- 535 Running Fawn Dr
- 412 Antler Ln
- 570 White Stag Ct
- 5395 Harbury Ln
- 487 Skiles Ct
- 972 Harvest Park Ln
- 5135 Amberden Hall Dr
- 5232 Tormeall Trace
- 0 Johnson Rd Unit 7677593
- 0 Johnson Rd Unit 10638841
- 0 Johnson Rd Unit CL344832
- 243 Wedmore Ct
- 5013 Briar Rose Ct
- 5157 Wellisford Ct Unit 8
- 731 Hexham Ct
- 3681 Trevi Ln
- 100 Hawnley Trace
- 262 Sandhurst Ct
- 600 Grimsby Ct
- 519 Running Doe Ct
- 0 Settles Brook Ct
- 540 Running Fawn Dr
- 539 Running Doe Ct
- 510R Running Fawn Dr
- 530 Running Fawn Dr
- 500 Running Fawn Dr
- 550 Running Fawn Dr Unit 1
- 509 Running Doe Ct Unit 1
- 534 Running Doe Ct Unit 1
- 524 Running Doe Ct
- 490 Running Fawn Dr
- 560 Running Fawn Dr
- 514 Running Doe Ct
- 480 Running Fawn Dr
- 5287 Running Doe Dr
- 504 Running Doe Ct Unit 1
- 5300 Spike Ct Unit 1
- 5277 Running Doe Dr
- 570 Running Fawn Dr
Your Personal Tour Guide
Ask me questions while you tour the home.