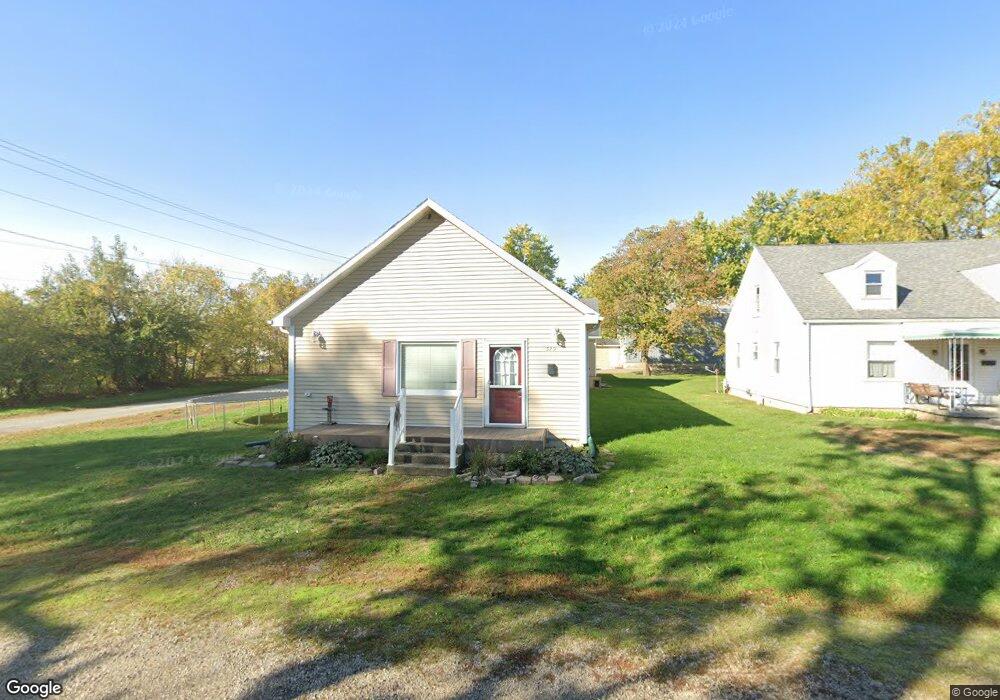
529 S Mill St Celina, OH 45822
Estimated Value: $153,000 - $192,609
3
Beds
2
Baths
1,225
Sq Ft
$140/Sq Ft
Est. Value
About This Home
This home is located at 529 S Mill St, Celina, OH 45822 and is currently estimated at $171,152, approximately $139 per square foot. 529 S Mill St is a home located in Mercer County with nearby schools including Celina Middle School, Celina High School, and Immaculate Conception School.
Ownership History
Date
Name
Owned For
Owner Type
Purchase Details
Closed on
Apr 7, 2010
Sold by
Toler Daniel and Toler Louise A
Bought by
Burden Travis A
Current Estimated Value
Home Financials for this Owner
Home Financials are based on the most recent Mortgage that was taken out on this home.
Original Mortgage
$68,367
Outstanding Balance
$44,709
Interest Rate
5.03%
Mortgage Type
New Conventional
Estimated Equity
$126,443
Purchase Details
Closed on
Oct 2, 2007
Sold by
Gray Ronald G and Gray Charlotte A
Bought by
Toler Daniel
Create a Home Valuation Report for This Property
The Home Valuation Report is an in-depth analysis detailing your home's value as well as a comparison with similar homes in the area
Home Values in the Area
Average Home Value in this Area
Purchase History
| Date | Buyer | Sale Price | Title Company |
|---|---|---|---|
| Burden Travis A | $64,500 | Attorney | |
| Toler Daniel | $11,428 | None Available |
Source: Public Records
Mortgage History
| Date | Status | Borrower | Loan Amount |
|---|---|---|---|
| Open | Burden Travis A | $68,367 |
Source: Public Records
Tax History
| Year | Tax Paid | Tax Assessment Tax Assessment Total Assessment is a certain percentage of the fair market value that is determined by local assessors to be the total taxable value of land and additions on the property. | Land | Improvement |
|---|---|---|---|---|
| 2025 | $2,206 | $55,410 | $6,790 | $48,620 |
| 2024 | $2,214 | $55,410 | $6,790 | $48,620 |
| 2023 | $2,206 | $55,410 | $6,790 | $48,620 |
| 2022 | $1,822 | $39,940 | $4,200 | $35,740 |
| 2021 | $1,631 | $35,670 | $4,200 | $31,470 |
| 2020 | $1,369 | $35,670 | $4,200 | $31,470 |
| 2019 | $908 | $22,200 | $3,400 | $18,800 |
| 2018 | $732 | $17,230 | $3,400 | $13,830 |
| 2017 | $763 | $17,230 | $3,400 | $13,830 |
| 2016 | $793 | $18,870 | $3,400 | $15,470 |
| 2015 | $766 | $18,770 | $3,400 | $15,370 |
| 2014 | $767 | $18,770 | $3,400 | $15,370 |
| 2013 | $815 | $18,770 | $3,400 | $15,370 |
Source: Public Records
Map
Nearby Homes
- 415 S Sugar St
- 617 Echo St
- 817 Murlin Ave
- 116 S Elm St
- 319 E Fayette St
- 328 E Livingston St
- 1125 W Bank Rd Unit 1125 107
- 120 E Blake St
- 630 N Brandon Ave
- 680 N Main St
- 545 E Anthony St
- 115 Touvelle St
- 802 E Market St
- 206 Magnolia St
- 314 Magnolia St
- 906 N Sugar St
- 908 N Sugar St
- 1001 N Sugar St
- 316 Dogwood Dr
- 1021 Hemlock St
Your Personal Tour Guide
Ask me questions while you tour the home.