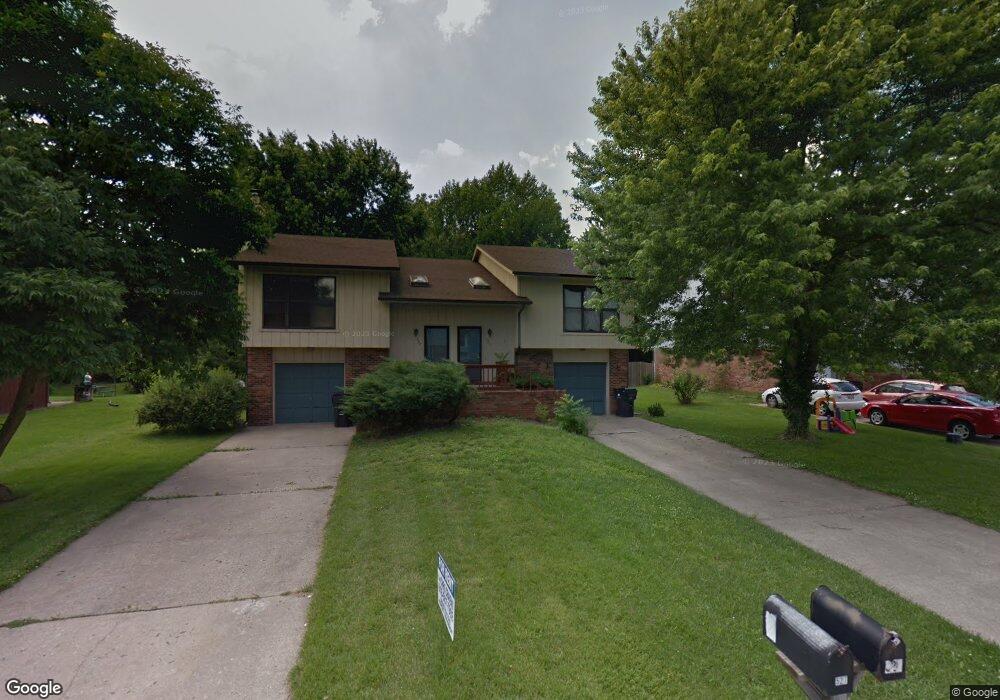
529 Vicksburg Dr Belleville, IL 62221
Estimated Value: $85,000 - $185,145
3
Beds
2
Baths
1,722
Sq Ft
$77/Sq Ft
Est. Value
About This Home
This home is located at 529 Vicksburg Dr, Belleville, IL 62221 and is currently estimated at $132,536, approximately $76 per square foot. 529 Vicksburg Dr is a home located in St. Clair County with nearby schools including Belle Valley Elementary School-North, Zion Lutheran School Belleville, and St Teresa Catholic School.
Ownership History
Date
Name
Owned For
Owner Type
Purchase Details
Closed on
Jun 21, 2012
Sold by
The Secretary Of Veterans Affairs
Bought by
Living Waters Properties Llc
Current Estimated Value
Home Financials for this Owner
Home Financials are based on the most recent Mortgage that was taken out on this home.
Original Mortgage
$46,240
Interest Rate
5.25%
Mortgage Type
New Conventional
Purchase Details
Closed on
Mar 23, 2012
Sold by
Smith Neshanta C
Bought by
The Secretary Of Veterans Affairs
Purchase Details
Closed on
Jun 16, 2005
Sold by
Childress Delisa F and Childress Paul
Bought by
Smith Neshanta C
Home Financials for this Owner
Home Financials are based on the most recent Mortgage that was taken out on this home.
Original Mortgage
$90,811
Interest Rate
5.82%
Mortgage Type
VA
Create a Home Valuation Report for This Property
The Home Valuation Report is an in-depth analysis detailing your home's value as well as a comparison with similar homes in the area
Home Values in the Area
Average Home Value in this Area
Purchase History
| Date | Buyer | Sale Price | Title Company |
|---|---|---|---|
| Living Waters Properties Llc | $53,000 | Fatic | |
| The Secretary Of Veterans Affairs | -- | None Available | |
| Smith Neshanta C | $89,000 | Fatic |
Source: Public Records
Mortgage History
| Date | Status | Borrower | Loan Amount |
|---|---|---|---|
| Closed | Living Waters Properties Llc | $46,240 | |
| Previous Owner | Smith Neshanta C | $90,811 |
Source: Public Records
Tax History
| Year | Tax Paid | Tax Assessment Tax Assessment Total Assessment is a certain percentage of the fair market value that is determined by local assessors to be the total taxable value of land and additions on the property. | Land | Improvement |
|---|---|---|---|---|
| 2024 | $3,885 | $38,136 | $5,910 | $32,226 |
| 2023 | $3,648 | $34,510 | $5,794 | $28,716 |
| 2022 | $3,406 | $31,068 | $5,216 | $25,852 |
| 2021 | $3,284 | $28,721 | $4,822 | $23,899 |
| 2020 | $3,226 | $27,160 | $4,560 | $22,600 |
| 2019 | $2,721 | $22,587 | $4,568 | $18,019 |
| 2018 | $2,625 | $22,098 | $4,469 | $17,629 |
| 2017 | $2,593 | $21,942 | $4,437 | $17,505 |
| 2016 | $2,552 | $21,476 | $4,343 | $17,133 |
| 2014 | $2,923 | $27,288 | $4,042 | $23,246 |
| 2013 | $2,239 | $27,678 | $4,100 | $23,578 |
Source: Public Records
Map
Nearby Homes
- 3335 Dovershire Dr
- 3306 Saratoga Dr Unit 3304/3306
- 3339 Dovershire Dr
- 3313 Denvershire Dr
- 3301 Fox Valley Ln
- 401 Garden Blvd
- 3213 West Blvd
- 2000 Camrose Green St
- 2004 Camrose Green St
- 2012 Camrose Green St
- 2016 Camrose Green St
- 2020 Camrose Green St
- 2049 Camrose Green St
- 2053 Camrose Green St
- 2057 Camrose Green St
- 3421 Fox Valley Ln
- 2061 Camrose Green St
- 2048 Camrose Green St
- 3425 Fox Valley Ln
- 2065 Camrose Green St
- 527 Vicksburg Dr
- 531 Vicksburg Dr
- 533 Vicksburg Dr
- 525 Vicksburg Dr
- 523 Vicksburg Dr
- 632 Vicksburg Dr
- 521 Vicksburg Dr
- 537 Vicksburg Dr
- 530 Vicksburg Dr
- 519 Vicksburg Dr
- 634 Vicksburg Dr
- 528 Vicksburg Dr
- 631 Vicksburg Dr Unit B
- 631 Vicksburg Dr
- 526 Vicksburg Dr
- 635 Vicksburg Dr
- 36 Robin Hill Ln
- 524 Vicksburg Dr
- 515 Vicksburg Dr
- 32 Robin Hill Ln
Your Personal Tour Guide
Ask me questions while you tour the home.