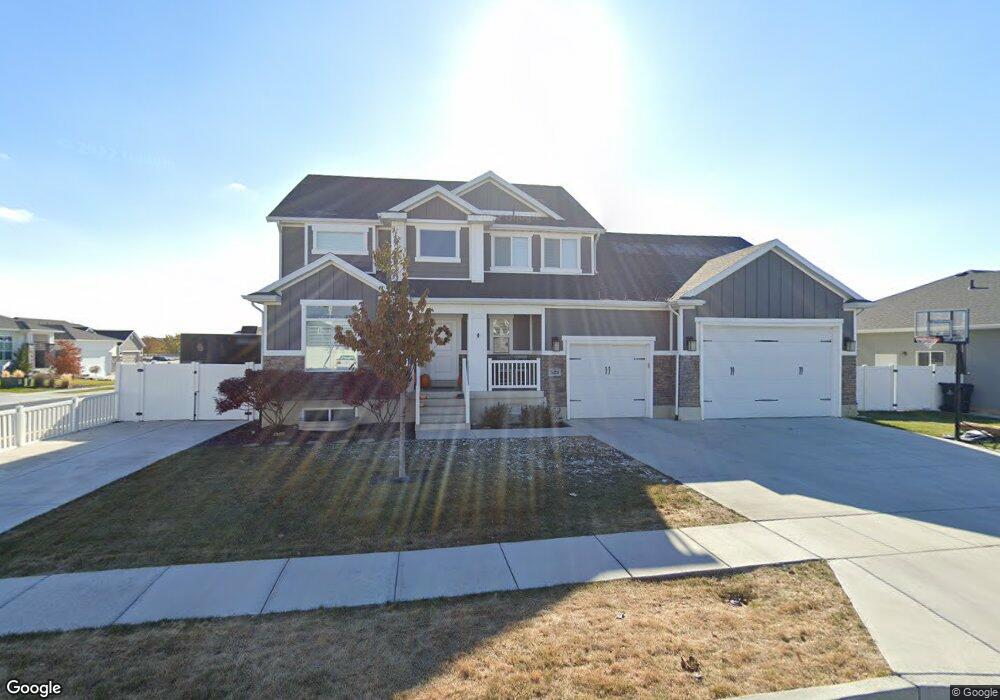
529 W 3100 S Syracuse, UT 84075
Estimated Value: $724,000 - $796,000
4
Beds
4
Baths
3,810
Sq Ft
$201/Sq Ft
Est. Value
About This Home
This home is located at 529 W 3100 S, Syracuse, UT 84075 and is currently estimated at $765,896, approximately $201 per square foot. 529 W 3100 S is a home located in Davis County with nearby schools including Legacy Junior High School, Clearfield High School, and North Davis Preparatory Academy.
Ownership History
Date
Name
Owned For
Owner Type
Purchase Details
Closed on
Oct 20, 2020
Sold by
Smith Scan and Smith Jaime
Bought by
Mangum Kody Dewain and Mangum Celestle Eve
Current Estimated Value
Home Financials for this Owner
Home Financials are based on the most recent Mortgage that was taken out on this home.
Original Mortgage
$517,500
Outstanding Balance
$460,289
Interest Rate
2.9%
Mortgage Type
New Conventional
Estimated Equity
$305,607
Create a Home Valuation Report for This Property
The Home Valuation Report is an in-depth analysis detailing your home's value as well as a comparison with similar homes in the area
Home Values in the Area
Average Home Value in this Area
Purchase History
| Date | Buyer | Sale Price | Title Company |
|---|---|---|---|
| Mangum Kody Dewain | -- | Metro National Title |
Source: Public Records
Mortgage History
| Date | Status | Borrower | Loan Amount |
|---|---|---|---|
| Open | Mangum Kody Dewain | $517,500 |
Source: Public Records
Tax History Compared to Growth
Tax History
| Year | Tax Paid | Tax Assessment Tax Assessment Total Assessment is a certain percentage of the fair market value that is determined by local assessors to be the total taxable value of land and additions on the property. | Land | Improvement |
|---|---|---|---|---|
| 2025 | $4,105 | $396,000 | $117,521 | $278,479 |
| 2024 | $4,037 | $392,150 | $96,072 | $296,078 |
| 2023 | $3,791 | $671,000 | $133,929 | $537,071 |
| 2022 | $3,696 | $358,600 | $81,315 | $277,285 |
| 2021 | $3,349 | $503,000 | $120,031 | $382,969 |
| 2020 | $2,888 | $420,000 | $105,154 | $314,846 |
| 2019 | $2,905 | $417,000 | $102,057 | $314,943 |
| 2018 | $2,730 | $389,000 | $98,955 | $290,045 |
| 2016 | $2,497 | $186,615 | $38,008 | $148,607 |
| 2015 | $1,890 | $134,513 | $38,008 | $96,505 |
| 2014 | $953 | $69,105 | $69,105 | $0 |
Source: Public Records
Map
Nearby Homes