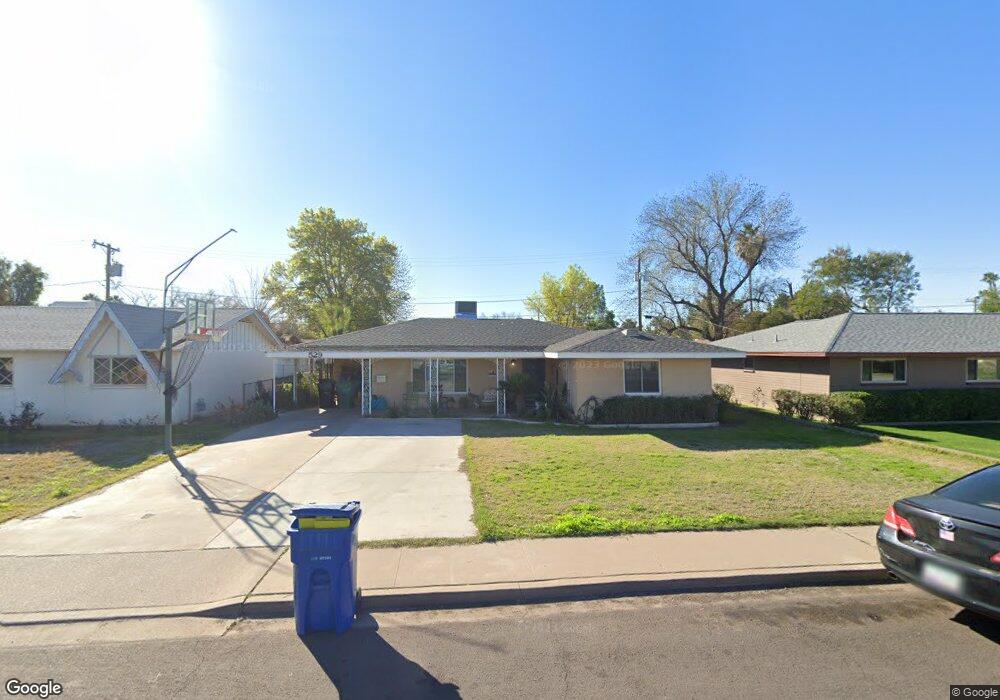
529 W 3rd St Mesa, AZ 85201
West Main NeighborhoodEstimated Value: $328,160 - $422,000
Studio
2
Baths
1,573
Sq Ft
$236/Sq Ft
Est. Value
About This Home
This home is located at 529 W 3rd St, Mesa, AZ 85201 and is currently estimated at $370,540, approximately $235 per square foot. 529 W 3rd St is a home located in Maricopa County with nearby schools including Franklin at Brimhall Elementary School, Emerson Elementary School, and Franklin West Elementary School.
Ownership History
Date
Name
Owned For
Owner Type
Purchase Details
Closed on
Apr 23, 2020
Sold by
Hathcock Dale W and Hathcock Julianna
Bought by
Hathcock Dale W and Hathcock Julianna
Current Estimated Value
Home Financials for this Owner
Home Financials are based on the most recent Mortgage that was taken out on this home.
Original Mortgage
$202,000
Outstanding Balance
$178,608
Interest Rate
3.3%
Mortgage Type
New Conventional
Estimated Equity
$191,932
Purchase Details
Closed on
Jun 2, 2000
Sold by
Bond Gwen
Bought by
Hatchcock Dale W and Hatchcock Julieann
Home Financials for this Owner
Home Financials are based on the most recent Mortgage that was taken out on this home.
Original Mortgage
$72,800
Interest Rate
8.15%
Mortgage Type
New Conventional
Create a Home Valuation Report for This Property
The Home Valuation Report is an in-depth analysis detailing your home's value as well as a comparison with similar homes in the area
Home Values in the Area
Average Home Value in this Area
Purchase History
| Date | Buyer | Sale Price | Title Company |
|---|---|---|---|
| Hathcock Dale W | -- | Magnus Title Agency | |
| Hatchcock Dale W | $91,000 | Nations Title Insurance |
Source: Public Records
Mortgage History
| Date | Status | Borrower | Loan Amount |
|---|---|---|---|
| Open | Hathcock Dale W | $202,000 | |
| Closed | Hatchcock Dale W | $72,800 | |
| Closed | Hatchcock Dale W | $18,071 |
Source: Public Records
Tax History
| Year | Tax Paid | Tax Assessment Tax Assessment Total Assessment is a certain percentage of the fair market value that is determined by local assessors to be the total taxable value of land and additions on the property. | Land | Improvement |
|---|---|---|---|---|
| 2025 | $802 | $9,652 | -- | -- |
| 2024 | $810 | $9,192 | -- | -- |
| 2023 | $810 | $28,470 | $5,690 | $22,780 |
| 2022 | $792 | $22,230 | $4,440 | $17,790 |
| 2021 | $814 | $19,420 | $3,880 | $15,540 |
| 2020 | $803 | $18,050 | $3,610 | $14,440 |
| 2019 | $744 | $16,950 | $3,390 | $13,560 |
| 2018 | $711 | $14,700 | $2,940 | $11,760 |
| 2017 | $688 | $13,930 | $2,780 | $11,150 |
| 2016 | $676 | $12,060 | $2,410 | $9,650 |
| 2015 | $638 | $10,720 | $2,140 | $8,580 |
Source: Public Records
Map
Nearby Homes
- 453 W 3rd Place
- 555 W University Dr
- 453 W University Dr
- 236 N Country Club Dr
- 141 N Date Unit 63
- 455 W 5th Place
- 921 W University Dr Unit 1030
- 921 W University Dr Unit 1232
- 606 N Country Club Dr
- 532 N Grand
- 547 W Mahoney Ave
- 124 W 1st St
- 509 W Dana Ave
- 1061 W 5th St
- 119 S Lebaron
- 837 N Revere Unit E
- 38 S Macdonald
- 443 N Center St
- 143 S Lebaron
- 861 N Revere Unit E
Your Personal Tour Guide
Ask me questions while you tour the home.