529 W Floral Ave Fresno, CA 93706
Estimated payment $12,137/month
76.56
Acres
$28,000
Price per Acre
3,334,954
Sq Ft Lot
About This Lot
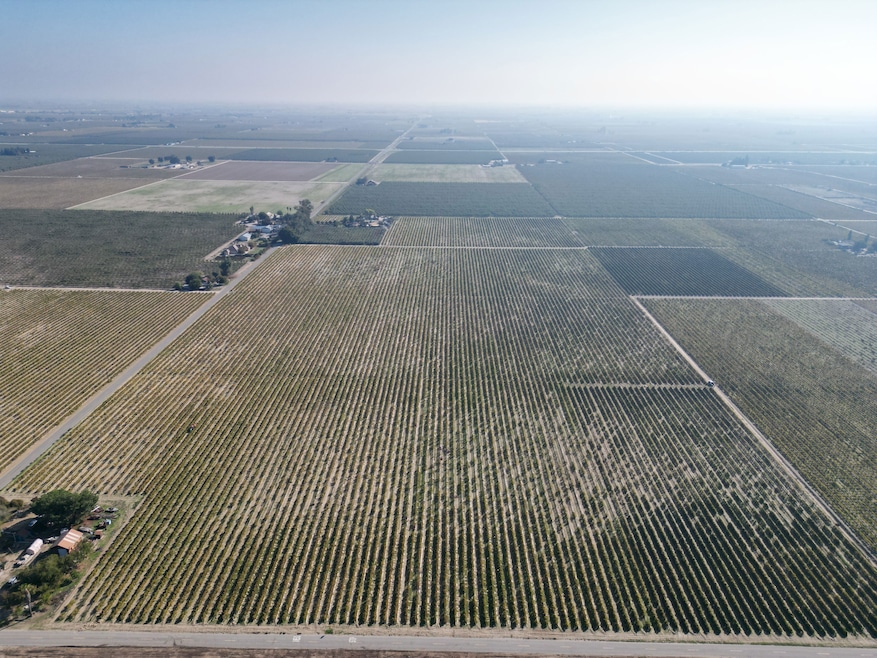
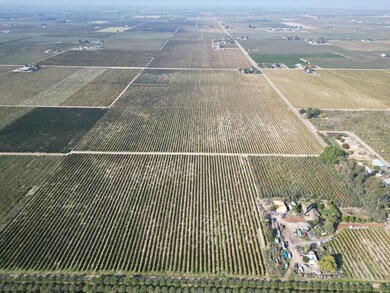
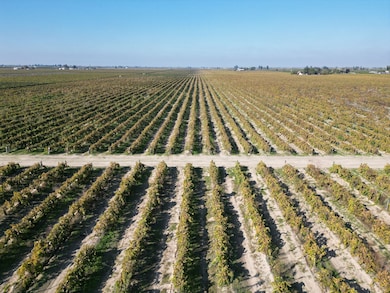
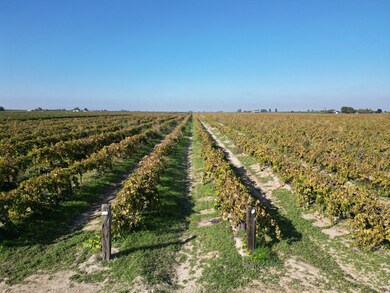
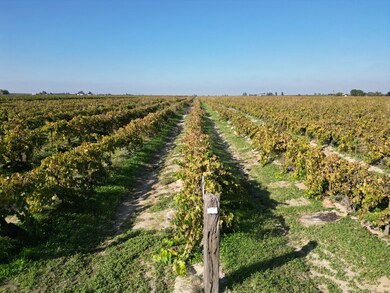
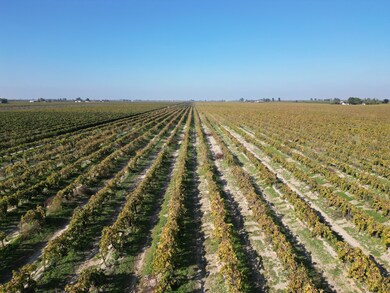
Opportunity to purchase approximately 76.56± assessed acres of a well-maintained, uniform Seedless Thompson vineyard located in Fresno County. The property lies within the Consolidated Irrigation District and is eligible to receive District water.
The property is irrigated via flood irrigation provided by (1) Agricultural Submersible Well, as well as within a highly desired irrigation district, Consolidated Irrigation District.
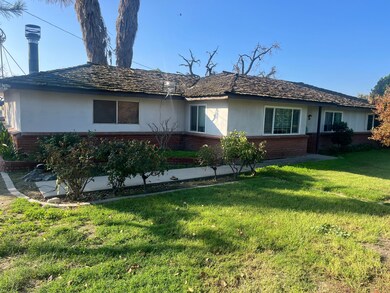
(1) 1,408± sqft home residence located on the subject property.
(1) Shop located on subject property
Listing Provided By

Property Details
Property Type
- Land
Est. Annual Taxes
- $10,066
Lot Details
- Dirt Road
- Current uses include agriculture, orchard/vineyards, agribusiness, vineyard, hobby farm, homestead
- Potential uses include agriculture, orchards/vineyards, hobby farm, vineyard
Utilities
- Well
Map
Create a Home Valuation Report for This Property
The Home Valuation Report is an in-depth analysis detailing your home's value as well as a comparison with similar homes in the area
Home Values in the Area
Average Home Value in this Area
Tax History
| Year | Tax Paid | Tax Assessment Tax Assessment Total Assessment is a certain percentage of the fair market value that is determined by local assessors to be the total taxable value of land and additions on the property. | Land | Improvement |
|---|---|---|---|---|
| 2025 | $10,066 | $596,331 | $167,629 | $428,702 |
| 2023 | $10,066 | $519,573 | $161,121 | $358,452 |
| 2022 | $9,357 | $509,386 | $157,962 | $351,424 |
| 2021 | $9,795 | $554,399 | $154,865 | $399,534 |
| 2020 | $9,783 | $549,280 | $153,278 | $396,002 |
| 2019 | $9,694 | $539,589 | $150,273 | $389,316 |
| 2018 | $7,160 | $508,423 | $265,258 | $243,165 |
| 2017 | $7,040 | $497,262 | $245,404 | $251,858 |
| 2016 | $6,869 | $495,582 | $141,607 | $353,975 |
| 2015 | $8,433 | $469,645 | $216,902 | $252,743 |
| 2014 | $4,672 | $443,930 | $200,875 | $243,055 |
Source: Public Records
Property History
| Date | Event | Price | List to Sale | Price per Sq Ft |
|---|---|---|---|---|
| 11/18/2025 11/18/25 | For Sale | $2,143,680 | -- | -- |
Nearby Homes
- 1375 W Rose Ave
- 25 W Dinuba Ave
- 0 S Walnut Ave Unit 631183
- 1105 E Rose Ave
- 795 E Springfield Ave
- 0 E Mountain View Ave
- 30 California 41
- 11561 S Hughes Ave
- 0 S Marks Ave Unit 637440
- 1095 E Mountain View Ave
- 0 S Cherry Ave Unit 236382
- 0 S Cherry Ave Unit 639853
- 8124 S Cherry Ave
- 2423 W Sandy St
- 2738 E Rose Ave
- 2810 W Missouri Ave
- 12420 S Chestnut Ave
- 0 Nec Chestnut & Mountain View Ave Unit 613340
- 162 E South Ave
- 10690 S Henderson Rd
- 2553 S Holloway Ave Unit 102
- 2458 S Backer Ave
- 2255 S Maple Ave
- 3670 Mccall Ave
- 1540 B St
- 11 E San Joaquin St
- 942 N Van Ness Ave
- 1560 Fulton St
- 1151 S Chestnut Ave
- 4860 E Lane Ave
- 2909 Huntington Blvd Unit 105
- 1824 Fulton St
- 1901 Fulton St
- 1133 E Divisadero St Unit Apartment
- 2157 S Eddy Ave
- 512 S Dearing Ave Unit 102
- 205 N Mariposa St
- 5120 E Kings Canyon Rd
- 392 N Ferger Ave
- 723-729 N Ferger Ave Unit 727