Estimated Value: $91,000 - $157,000
2
Beds
1
Bath
1,296
Sq Ft
$102/Sq Ft
Est. Value
About This Home
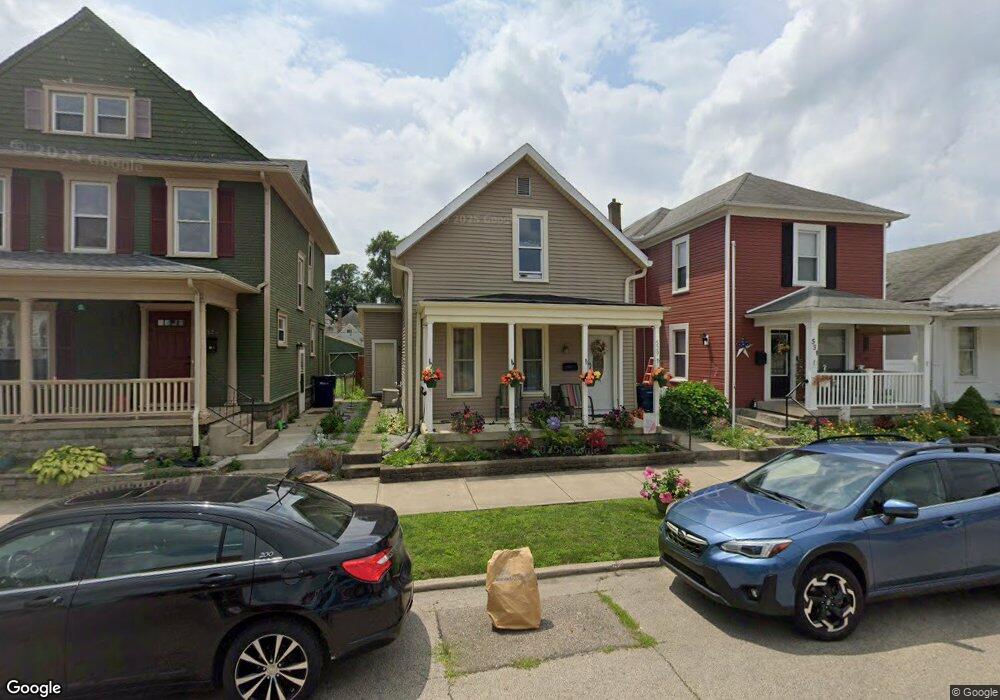
This home is located at 529 W Greene St, Piqua, OH 45356 and is currently estimated at $132,412, approximately $102 per square foot. 529 W Greene St is a home located in Miami County with nearby schools including Washington Primary School, Piqua Junior High School, and Piqua High School.
Ownership History
Date
Name
Owned For
Owner Type
Purchase Details
Closed on
Jun 1, 2004
Sold by
Kiefer Theodore S and Kiefer Jamie
Bought by
Bayman Diane and Bayman Charles
Current Estimated Value
Home Financials for this Owner
Home Financials are based on the most recent Mortgage that was taken out on this home.
Original Mortgage
$76,007
Outstanding Balance
$35,294
Interest Rate
5.91%
Mortgage Type
FHA
Estimated Equity
$97,118
Purchase Details
Closed on
Apr 4, 1995
Sold by
Black Charles D
Bought by
Kiefer Theodore S
Create a Home Valuation Report for This Property
The Home Valuation Report is an in-depth analysis detailing your home's value as well as a comparison with similar homes in the area
Home Values in the Area
Average Home Value in this Area
Purchase History
| Date | Buyer | Sale Price | Title Company |
|---|---|---|---|
| Bayman Diane | $77,220 | -- | |
| Kiefer Theodore S | $62,900 | -- |
Source: Public Records
Mortgage History
| Date | Status | Borrower | Loan Amount |
|---|---|---|---|
| Open | Bayman Diane | $76,007 | |
| Closed | Kiefer Theodore S | -- |
Source: Public Records
Tax History
| Year | Tax Paid | Tax Assessment Tax Assessment Total Assessment is a certain percentage of the fair market value that is determined by local assessors to be the total taxable value of land and additions on the property. | Land | Improvement |
|---|---|---|---|---|
| 2025 | $1,348 | $38,190 | $6,200 | $31,990 |
| 2024 | $1,348 | $28,600 | $6,720 | $21,880 |
| 2023 | $1,175 | $28,600 | $6,720 | $21,880 |
| 2022 | $1,196 | $28,600 | $6,720 | $21,880 |
| 2021 | $1,007 | $22,020 | $5,180 | $16,840 |
| 2020 | $987 | $22,020 | $5,180 | $16,840 |
| 2019 | $992 | $22,020 | $5,180 | $16,840 |
| 2018 | $933 | $19,780 | $5,180 | $14,600 |
| 2017 | $945 | $19,780 | $5,180 | $14,600 |
| 2016 | $934 | $19,780 | $5,180 | $14,600 |
| 2015 | $919 | $19,010 | $4,970 | $14,040 |
| 2014 | $919 | $19,010 | $4,970 | $14,040 |
| 2013 | $922 | $19,010 | $4,970 | $14,040 |
Source: Public Records
Map
Nearby Homes
- 522 W North St
- 333 W Greene St
- 211 Franklin St
- 630 Boone St
- 651 Boone St
- 825 W Greene St
- 735 Park Ave
- 651 N Downing St Unit 8
- 423 N Wayne St
- 924 W North St
- 412 Camp St
- 615 N Wayne St
- 107 Riverside Dr
- 931 Caldwell St
- 128 S Wayne St
- 908 Camp St
- 419 Riverside Dr
- 454 Riverside Dr
- 523 Harrison St
- 1062 Boone St
Your Personal Tour Guide
Ask me questions while you tour the home.