Estimated Value: $133,000 - $139,980
--
Bed
--
Bath
--
Sq Ft
7,841
Sq Ft Lot
About This Home
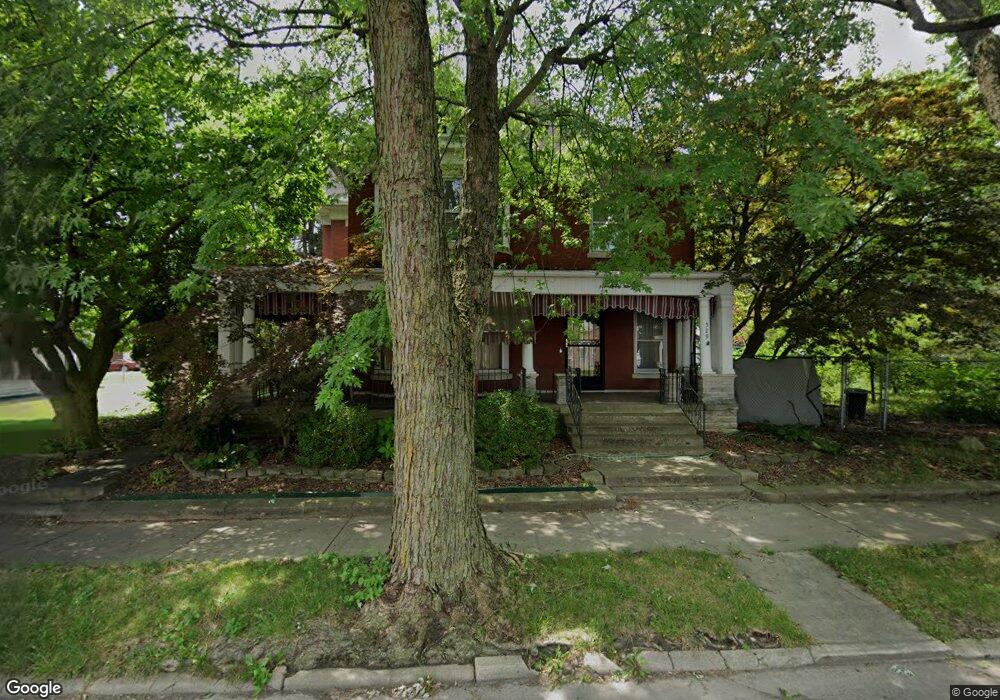
This home is located at 529 W High St, Piqua, OH 45356 and is currently estimated at $136,490. 529 W High St is a home located in Miami County with nearby schools including Washington Primary School, Piqua Junior High School, and Piqua High School.
Ownership History
Date
Name
Owned For
Owner Type
Purchase Details
Closed on
Jan 25, 2012
Sold by
Federal Home Loan Mortgage Corporation
Bought by
Citimortgage Inc
Current Estimated Value
Purchase Details
Closed on
Apr 15, 2011
Sold by
Johnson Gregory K and Johnson Paula K
Bought by
Federal Home Loan Mortgage Corp
Purchase Details
Closed on
Apr 11, 2011
Sold by
Johnson Gregory K and Johnson Paula K
Bought by
Federal Home Loan Mortgage Corp
Purchase Details
Closed on
Jun 30, 1999
Sold by
Cota Glenn and Cota Shirley
Bought by
Fulker John E
Purchase Details
Closed on
Jan 1, 1990
Bought by
Cota Glenn
Create a Home Valuation Report for This Property
The Home Valuation Report is an in-depth analysis detailing your home's value as well as a comparison with similar homes in the area
Home Values in the Area
Average Home Value in this Area
Purchase History
| Date | Buyer | Sale Price | Title Company |
|---|---|---|---|
| Citimortgage Inc | $116,302 | -- | |
| Federal Home Loan Mortgage Corp | $92,000 | -- | |
| Federal Home Loan Mortgage Corp | $92,000 | -- | |
| Fulker John E | -- | -- | |
| Cota Glenn | -- | -- |
Source: Public Records
Tax History Compared to Growth
Tax History
| Year | Tax Paid | Tax Assessment Tax Assessment Total Assessment is a certain percentage of the fair market value that is determined by local assessors to be the total taxable value of land and additions on the property. | Land | Improvement |
|---|---|---|---|---|
| 2024 | $539 | $12,780 | $7,880 | $4,900 |
| 2023 | $539 | $12,780 | $7,880 | $4,900 |
| 2022 | $548 | $12,780 | $7,880 | $4,900 |
| 2021 | $460 | $9,840 | $6,060 | $3,780 |
| 2020 | $452 | $9,840 | $6,060 | $3,780 |
| 2019 | $455 | $9,840 | $6,060 | $3,780 |
| 2018 | $457 | $9,420 | $6,090 | $3,330 |
| 2017 | $462 | $9,420 | $6,090 | $3,330 |
| 2016 | $458 | $9,420 | $6,090 | $3,330 |
| 2015 | $449 | $9,040 | $5,850 | $3,190 |
| 2014 | $449 | $9,040 | $5,850 | $3,190 |
| 2013 | $451 | $9,040 | $5,850 | $3,190 |
Source: Public Records
Map
Nearby Homes