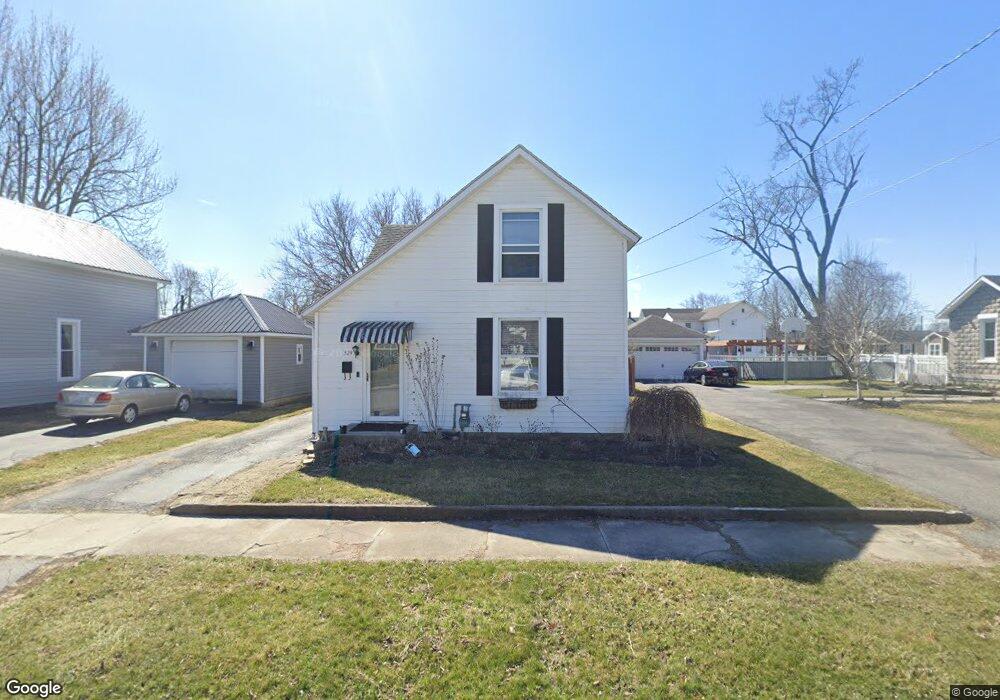
529 W Lima St Findlay, OH 45840
Estimated Value: $156,000 - $176,223
2
Beds
2
Baths
1,315
Sq Ft
$123/Sq Ft
Est. Value
About This Home
This home is located at 529 W Lima St, Findlay, OH 45840 and is currently estimated at $161,806, approximately $123 per square foot. 529 W Lima St is a home located in Hancock County with nearby schools including Lincoln Elementary School, Donnell Middle School, and Findlay High School.
Ownership History
Date
Name
Owned For
Owner Type
Purchase Details
Closed on
Jul 31, 2006
Sold by
Corner Sean D
Bought by
Flores Stephanie M and Flores Gloria
Current Estimated Value
Home Financials for this Owner
Home Financials are based on the most recent Mortgage that was taken out on this home.
Original Mortgage
$81,225
Outstanding Balance
$48,925
Interest Rate
6.82%
Mortgage Type
FHA
Estimated Equity
$112,881
Purchase Details
Closed on
Apr 14, 1993
Bought by
Corner Sean D
Purchase Details
Closed on
Mar 29, 1993
Bought by
Baker James E and Baker Linda D
Purchase Details
Closed on
Dec 30, 1985
Bought by
Aller Jerry
Create a Home Valuation Report for This Property
The Home Valuation Report is an in-depth analysis detailing your home's value as well as a comparison with similar homes in the area
Home Values in the Area
Average Home Value in this Area
Purchase History
| Date | Buyer | Sale Price | Title Company |
|---|---|---|---|
| Flores Stephanie M | $82,500 | Mid Am Title | |
| Corner Sean D | $64,000 | -- | |
| Baker James E | $38,000 | -- | |
| Aller Jerry | $39,900 | -- |
Source: Public Records
Mortgage History
| Date | Status | Borrower | Loan Amount |
|---|---|---|---|
| Open | Flores Stephanie M | $81,225 |
Source: Public Records
Tax History Compared to Growth
Tax History
| Year | Tax Paid | Tax Assessment Tax Assessment Total Assessment is a certain percentage of the fair market value that is determined by local assessors to be the total taxable value of land and additions on the property. | Land | Improvement |
|---|---|---|---|---|
| 2024 | $1,624 | $45,710 | $4,900 | $40,810 |
| 2023 | $1,626 | $45,710 | $4,900 | $40,810 |
| 2022 | $1,621 | $45,710 | $4,900 | $40,810 |
| 2021 | $1,326 | $32,570 | $5,020 | $27,550 |
| 2020 | $1,325 | $32,570 | $5,020 | $27,550 |
| 2019 | $1,299 | $32,570 | $5,020 | $27,550 |
| 2018 | $1,133 | $26,060 | $4,020 | $22,040 |
| 2017 | $567 | $26,060 | $4,020 | $22,040 |
| 2016 | $1,126 | $26,060 | $4,020 | $22,040 |
| 2015 | $822 | $18,800 | $2,570 | $16,230 |
| 2014 | $822 | $18,800 | $2,570 | $16,230 |
| 2012 | $829 | $18,800 | $2,570 | $16,230 |
Source: Public Records
Map
Nearby Homes
- 527 W Lincoln St
- 419 W Lincoln St
- 412 Lima Ave
- 416 1/2 Lima Ave
- 720 S West St
- 905 S West St
- 225 Lima Ave
- 514 Liberty St
- 801 W Sandusky St
- 1115 Liberty St
- 202 Hancock St
- 829 Maple Ave
- 915 W Main Cross St
- 407 Washington St
- 210 Western Ave
- 1421 Hurd Ave
- 123 Glendale Ave
- 420 1st St
- 817 Park St
- 1109 Park St