529 W Main St Bushnell, IL 61422
Estimated Value: $97,000 - $137,000
2
Beds
--
Bath
1,247
Sq Ft
$92/Sq Ft
Est. Value
About This Home
This home is located at 529 W Main St, Bushnell, IL 61422 and is currently estimated at $115,061, approximately $92 per square foot. 529 W Main St is a home located in McDonough County with nearby schools including Bushnell-Prairie City Elementary School, Bushnell-Prairie City Junior High School, and Bushnell-Prairie City High School.
Ownership History
Date
Name
Owned For
Owner Type
Purchase Details
Closed on
May 3, 2024
Sold by
Jackson Reed and Hannah Reed Hannah
Bought by
Slater Properties And Rentals Inc
Current Estimated Value
Home Financials for this Owner
Home Financials are based on the most recent Mortgage that was taken out on this home.
Original Mortgage
$82,502
Outstanding Balance
$81,343
Interest Rate
6.87%
Mortgage Type
New Conventional
Estimated Equity
$33,718
Purchase Details
Closed on
May 26, 2021
Sold by
Priesner Steven R and Priesner Wendi J
Bought by
Reed Jackson and Reed Hannah
Home Financials for this Owner
Home Financials are based on the most recent Mortgage that was taken out on this home.
Original Mortgage
$75,956
Interest Rate
3%
Mortgage Type
FHA
Create a Home Valuation Report for This Property
The Home Valuation Report is an in-depth analysis detailing your home's value as well as a comparison with similar homes in the area
Home Values in the Area
Average Home Value in this Area
Purchase History
| Date | Buyer | Sale Price | Title Company |
|---|---|---|---|
| Slater Properties And Rentals Inc | -- | None Listed On Document | |
| Reed Jackson | $100,000 | None Available |
Source: Public Records
Mortgage History
| Date | Status | Borrower | Loan Amount |
|---|---|---|---|
| Open | Slater Properties And Rentals Inc | $82,502 | |
| Previous Owner | Reed Jackson | $75,956 |
Source: Public Records
Tax History Compared to Growth
Tax History
| Year | Tax Paid | Tax Assessment Tax Assessment Total Assessment is a certain percentage of the fair market value that is determined by local assessors to be the total taxable value of land and additions on the property. | Land | Improvement |
|---|---|---|---|---|
| 2024 | $3,085 | $33,542 | $3,355 | $30,187 |
| 2023 | $2,967 | $33,186 | $3,319 | $29,867 |
| 2022 | $1,985 | $22,057 | $2,806 | $19,251 |
| 2021 | $1,905 | $21,117 | $2,686 | $18,431 |
| 2020 | $1,928 | $23,467 | $2,648 | $20,819 |
| 2019 | $2,006 | $21,693 | $2,759 | $18,934 |
| 2018 | $2,003 | $22,147 | $2,817 | $19,330 |
| 2017 | $2,002 | $21,831 | $2,777 | $19,054 |
| 2016 | $1,321 | $20,186 | $2,568 | $17,618 |
| 2015 | $1,340 | $20,186 | $2,568 | $17,618 |
| 2014 | $1,396 | $19,878 | $2,529 | $17,349 |
| 2013 | $1,372 | $21,472 | $2,732 | $18,740 |
Source: Public Records
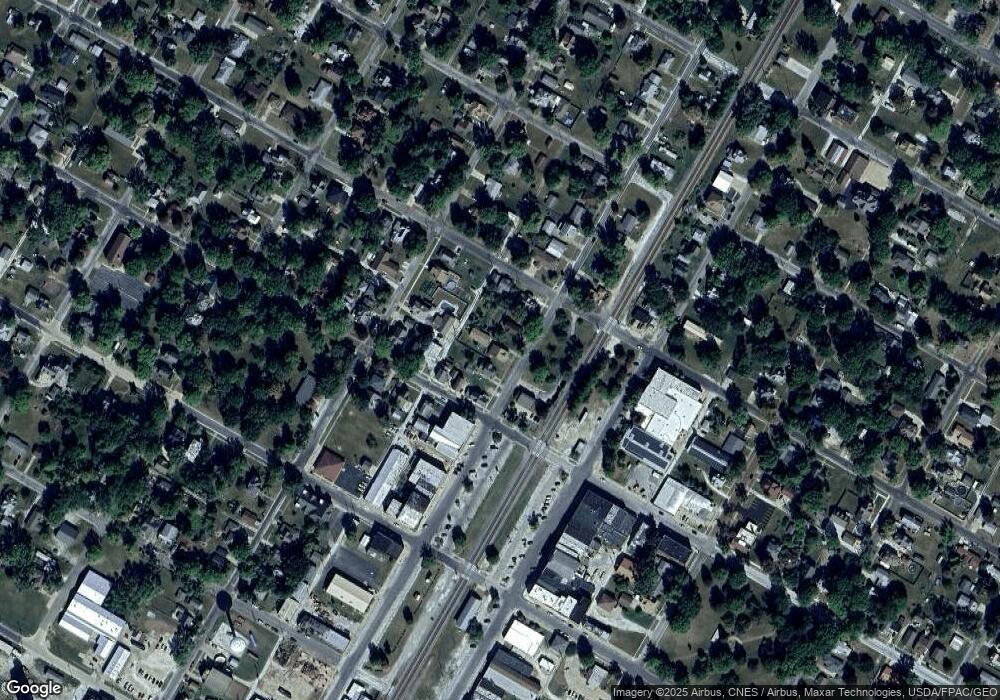
Map
Nearby Homes
- 195 W Hail St
- 555 N Jackson St
- 134 W Osborne St
- 425 N Jackson St
- 310 N Dean St
- 651 N Washington St
- 651 N Sperry St
- 924 N Crafford St
- 1024 W Main St
- 994 N Crafford St
- 777 Cole St
- 295 W Harris Ave
- 4 Hiel Dr
- 14 Hillcrest Dr
- 20620 N 2300th Rd
- 20620 N 2300 Rd
- 22561 N Cornerstone Rd
- 18520 N 1450th Rd
- 300 S Park St
- 16905 E 1600th St