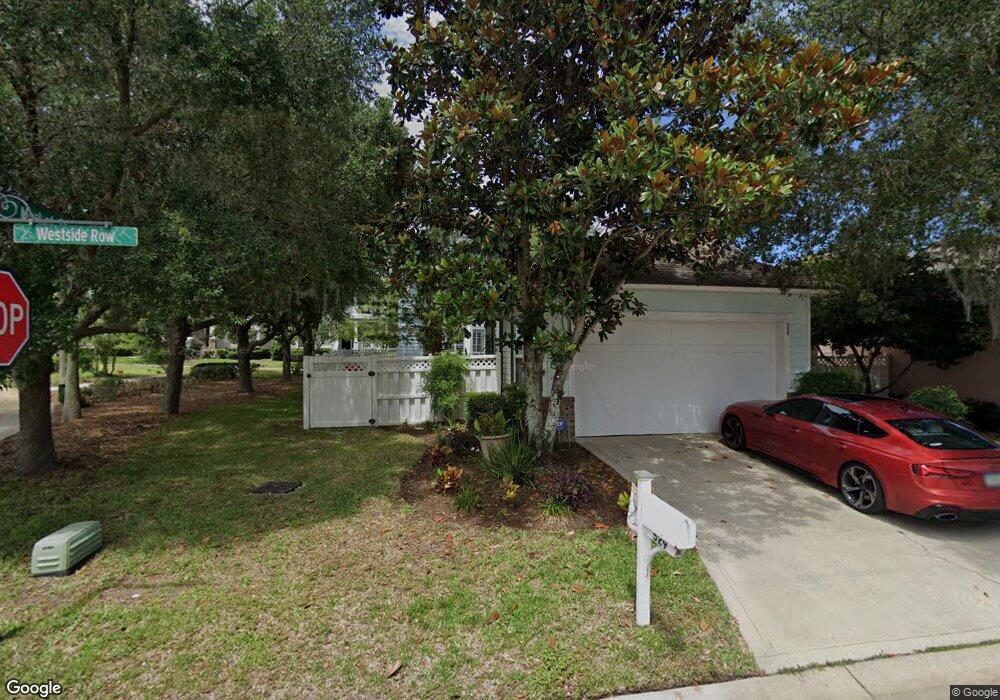
529 W Side Row St. Augustine, FL 32095
Palencia NeighborhoodEstimated Value: $446,000 - $579,000
3
Beds
3
Baths
2,233
Sq Ft
$229/Sq Ft
Est. Value
About This Home
This home is located at 529 W Side Row, St. Augustine, FL 32095 and is currently estimated at $512,418, approximately $229 per square foot. 529 W Side Row is a home located in St. Johns County with nearby schools including Palencia Elementary School, Pacetti Bay Middle School, and Allen D. Nease Senior High School.
Ownership History
Date
Name
Owned For
Owner Type
Purchase Details
Closed on
Apr 10, 2015
Sold by
Ih2 Properperty Lp
Bought by
2015-2 Ih Borrower Lp
Current Estimated Value
Purchase Details
Closed on
Oct 31, 2013
Sold by
Pierson James and De Maria Karen A
Bought by
Ih2 Property Florida Lp
Purchase Details
Closed on
Sep 27, 2005
Sold by
Toll Jacksonville Lp
Bought by
Pierson James and Demaria Karen A
Home Financials for this Owner
Home Financials are based on the most recent Mortgage that was taken out on this home.
Original Mortgage
$304,000
Interest Rate
5.72%
Mortgage Type
Fannie Mae Freddie Mac
Create a Home Valuation Report for This Property
The Home Valuation Report is an in-depth analysis detailing your home's value as well as a comparison with similar homes in the area
Home Values in the Area
Average Home Value in this Area
Purchase History
| Date | Buyer | Sale Price | Title Company |
|---|---|---|---|
| 2015-2 Ih Borrower Lp | -- | None Available | |
| Ih2 Property Florida Lp | $240,000 | Island Title Of St Augustine | |
| Pierson James | $382,400 | -- |
Source: Public Records
Mortgage History
| Date | Status | Borrower | Loan Amount |
|---|---|---|---|
| Previous Owner | Pierson James | $304,000 |
Source: Public Records
Tax History
| Year | Tax Paid | Tax Assessment Tax Assessment Total Assessment is a certain percentage of the fair market value that is determined by local assessors to be the total taxable value of land and additions on the property. | Land | Improvement |
|---|---|---|---|---|
| 2025 | $7,902 | $380,856 | -- | -- |
| 2024 | $7,902 | $414,352 | $100,000 | $314,352 |
| 2023 | $7,902 | $393,517 | $90,000 | $303,517 |
| 2022 | $7,830 | $414,134 | $70,000 | $344,134 |
| 2021 | $6,911 | $260,130 | $0 | $0 |
| 2020 | $6,963 | $260,901 | $0 | $0 |
| 2019 | $6,977 | $254,032 | $0 | $0 |
| 2018 | $6,807 | $245,703 | $0 | $0 |
| 2017 | $6,891 | $251,647 | $55,000 | $196,647 |
| 2016 | $6,689 | $235,260 | $0 | $0 |
| 2015 | $6,096 | $196,176 | $0 | $0 |
| 2014 | $6,015 | $188,410 | $0 | $0 |
Source: Public Records
Map
Nearby Homes
- 400 Central St
- 630 Market St
- 554 Market St
- 654 S Loop Pkwy
- 620 Palencia Club Dr Unit 305
- 744 S Loop Pkwy
- 213 Spanish Marsh Dr
- 145 Spanish Marsh Dr
- 168 Spanish Marsh Dr
- 152 Spanish Marsh Dr
- 216 Spanish Marsh Dr
- 161 Augustine Island Way
- 333 Stokes Creek Dr
- 159 La Mesa Dr
- 205 Sophia Terrace
- 148 La Mesa Dr
- 804 Cypress Crossing Trail
- 808 Cypress Crossing Trail
- 1104 Westfield Way
- 1121 Westfield Way
Your Personal Tour Guide
Ask me questions while you tour the home.