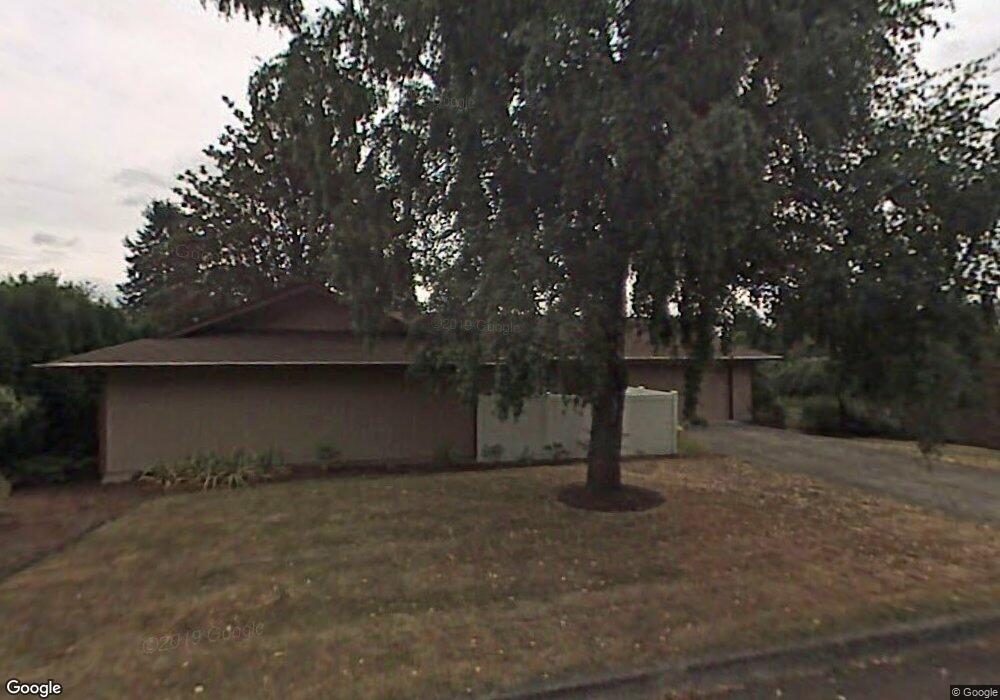
52900 NW Cliff Dr Scappoose, OR 97056
Estimated Value: $496,000 - $563,000
3
Beds
2
Baths
1,372
Sq Ft
$376/Sq Ft
Est. Value
About This Home
This home is located at 52900 NW Cliff Dr, Scappoose, OR 97056 and is currently estimated at $516,428, approximately $376 per square foot. 52900 NW Cliff Dr is a home located in Columbia County with nearby schools including Scappoose High School, South Columbia Family School, and Scappoose Adventist School.
Ownership History
Date
Name
Owned For
Owner Type
Purchase Details
Closed on
Nov 12, 2015
Sold by
Tussing Nathaniel T and Tussing Juli
Bought by
Braun Tim
Current Estimated Value
Home Financials for this Owner
Home Financials are based on the most recent Mortgage that was taken out on this home.
Original Mortgage
$231,725
Outstanding Balance
$181,756
Interest Rate
3.87%
Mortgage Type
FHA
Estimated Equity
$334,672
Purchase Details
Closed on
Feb 17, 2011
Sold by
Shuman Robert J
Bought by
Tussing Nathaniel T and Tussing Juli
Home Financials for this Owner
Home Financials are based on the most recent Mortgage that was taken out on this home.
Original Mortgage
$164,400
Interest Rate
4.67%
Mortgage Type
New Conventional
Create a Home Valuation Report for This Property
The Home Valuation Report is an in-depth analysis detailing your home's value as well as a comparison with similar homes in the area
Home Values in the Area
Average Home Value in this Area
Purchase History
| Date | Buyer | Sale Price | Title Company |
|---|---|---|---|
| Braun Tim | $237,000 | Multiple | |
| Tussing Nathaniel T | $162,500 | Ticor Title |
Source: Public Records
Mortgage History
| Date | Status | Borrower | Loan Amount |
|---|---|---|---|
| Open | Braun Tim | $231,725 | |
| Previous Owner | Tussing Nathaniel T | $164,400 |
Source: Public Records
Tax History Compared to Growth
Tax History
| Year | Tax Paid | Tax Assessment Tax Assessment Total Assessment is a certain percentage of the fair market value that is determined by local assessors to be the total taxable value of land and additions on the property. | Land | Improvement |
|---|---|---|---|---|
| 2025 | $4,522 | $274,670 | $98,250 | $176,420 |
| 2024 | $4,397 | $266,670 | $95,390 | $171,280 |
| 2023 | $4,356 | $258,910 | $95,390 | $163,520 |
| 2022 | $4,172 | $251,370 | $92,610 | $158,760 |
| 2021 | $4,053 | $244,050 | $99,440 | $144,610 |
| 2020 | $3,759 | $236,950 | $94,600 | $142,350 |
| 2019 | $3,350 | $210,540 | $91,050 | $119,490 |
| 2018 | $3,274 | $204,410 | $106,260 | $98,150 |
| 2017 | $3,215 | $198,460 | $103,160 | $95,300 |
| 2016 | $3,174 | $192,680 | $100,150 | $92,530 |
| 2015 | $3,014 | $187,070 | $84,700 | $102,370 |
| 2014 | $2,938 | $181,630 | $80,260 | $101,370 |
Source: Public Records
Map
Nearby Homes
- 32952 NW Ridge Dr
- 32904 NW View Terrace Place
- 33062 Bellcrest Rd
- 33399 NW Ej Smith Rd
- 33374 Wickstrom Dr
- 32898 SW Keys Landing Way
- 32373 Jp West Rd
- 52866 NE 2nd St
- 53194 Columbia River Hwy
- 32839 SW Crystal Springs Ct
- 33344 SW Rokin Way
- 33363 SW Rokin Way
- 33358 SW Rokin Way
- 33374 SW Rokin Way
- 33375 SW Rokin Way
- 32922 Coal Creek Rd
- 33370 SW Rokin Way
- 51925 Columbia River Hwy
- 51587 SE Oak St
- 51425 SE Oak St Unit 65
- 52902 NW Cliff Dr
- 32893 NW Peak Rd
- 32899 NW Peak Rd
- 52909 NW Cliff Dr
- 32847 NW Peak Rd
- 000 NW Peak Rd
- 52904 NW Cliff Dr
- 52970 NW Rose St
- 52970 NW Rose St
- 32915 NW Peak Rd
- 52911 NW Cliff Dr
- 32861 NW Peak Rd
- 52906 NW Cliff Dr
- 32919 NW Peak Rd
- 32898 NW Ridge Dr
- 32858 NW Peak Rd
- 32831 NW Peak Rd
- 32872 NW Ridge Dr
- 52908 NW Cliff Dr
- 52910 NW Cliff Dr