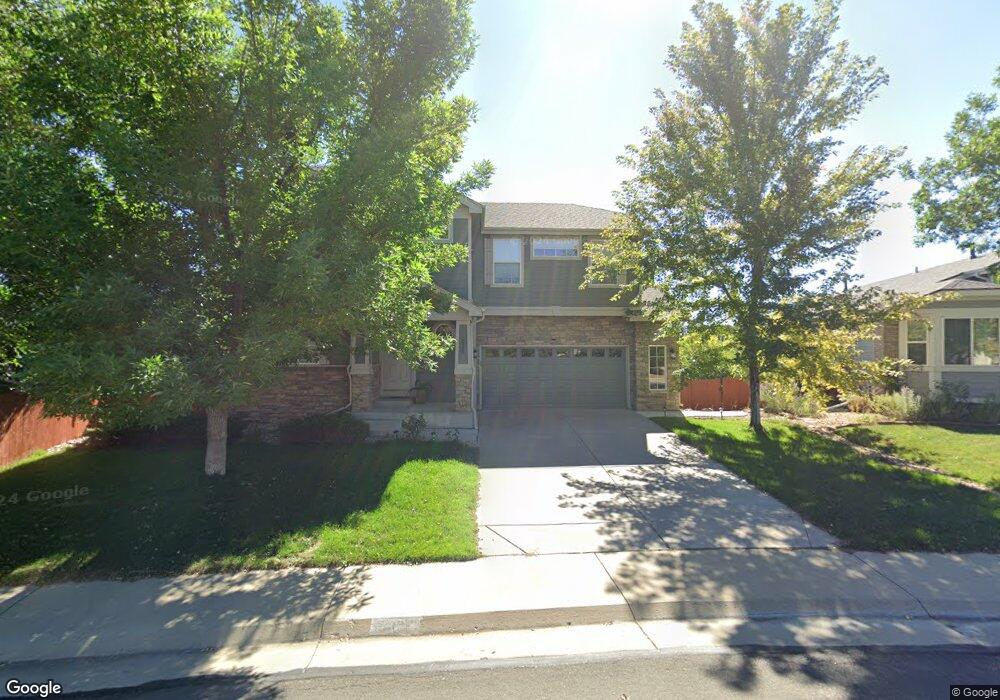
5292 E 116th Ave Thornton, CO 80233
Holly Point NeighborhoodEstimated Value: $556,298 - $588,000
3
Beds
3
Baths
2,456
Sq Ft
$233/Sq Ft
Est. Value
About This Home
This home is located at 5292 E 116th Ave, Thornton, CO 80233 and is currently estimated at $571,575, approximately $232 per square foot. 5292 E 116th Ave is a home located in Adams County with nearby schools including Cherry Drive Elementary School, Shadow Ridge Middle School, and Mountain Range High School.
Ownership History
Date
Name
Owned For
Owner Type
Purchase Details
Closed on
Jun 18, 2018
Sold by
Roeber Ann E and Roeber Brent W
Bought by
Gharat Amol
Current Estimated Value
Home Financials for this Owner
Home Financials are based on the most recent Mortgage that was taken out on this home.
Original Mortgage
$384,750
Outstanding Balance
$332,744
Interest Rate
4.5%
Mortgage Type
New Conventional
Estimated Equity
$238,831
Purchase Details
Closed on
Aug 21, 2001
Sold by
Kdb Homes Inc
Bought by
Roeber Brent W and Roeber Ann E
Home Financials for this Owner
Home Financials are based on the most recent Mortgage that was taken out on this home.
Original Mortgage
$218,376
Interest Rate
7.16%
Mortgage Type
FHA
Create a Home Valuation Report for This Property
The Home Valuation Report is an in-depth analysis detailing your home's value as well as a comparison with similar homes in the area
Home Values in the Area
Average Home Value in this Area
Purchase History
| Date | Buyer | Sale Price | Title Company |
|---|---|---|---|
| Gharat Amol | $405,000 | North American Title | |
| Roeber Brent W | $226,473 | -- |
Source: Public Records
Mortgage History
| Date | Status | Borrower | Loan Amount |
|---|---|---|---|
| Open | Gharat Amol | $384,750 | |
| Previous Owner | Roeber Brent W | $218,376 |
Source: Public Records
Tax History Compared to Growth
Tax History
| Year | Tax Paid | Tax Assessment Tax Assessment Total Assessment is a certain percentage of the fair market value that is determined by local assessors to be the total taxable value of land and additions on the property. | Land | Improvement |
|---|---|---|---|---|
| 2024 | $3,676 | $33,750 | $7,500 | $26,250 |
| 2023 | $3,639 | $39,230 | $7,370 | $31,860 |
| 2022 | $3,385 | $30,730 | $7,580 | $23,150 |
| 2021 | $3,497 | $30,730 | $7,580 | $23,150 |
| 2020 | $3,280 | $29,400 | $7,790 | $21,610 |
| 2019 | $3,286 | $29,400 | $7,790 | $21,610 |
| 2018 | $2,902 | $25,220 | $6,840 | $18,380 |
| 2017 | $2,639 | $25,220 | $6,840 | $18,380 |
| 2016 | $2,146 | $19,970 | $4,300 | $15,670 |
| 2015 | $2,143 | $19,970 | $4,300 | $15,670 |
| 2014 | $1,931 | $17,490 | $3,820 | $13,670 |
Source: Public Records
Map
Nearby Homes
- 11343 Grape Cir
- 11354 Jersey St
- 11279 Holly St
- 11293 Holly St
- 5055 E 112th Ct
- 5056 E 112th Ct
- 4911 E 112th Place
- 11841 Elm Dr
- 11918 Glencoe Dr
- 11062 Fairfax Cir
- 11921 Kearney Cir
- 4520 E 112th Place
- 4807 E 110th Place
- 4355 E 118th Ave
- 11068 Eudora Cir
- 5160 E 120th Place
- 11135 Clermont Dr
- 10985 Glencoe Place
- 5020 E 120th Place
- 4970 E 120th Place
- 11521 Glencoe St
- 11547 Glencoe St
- 11513 Glencoe St
- 5277 E 115th Ave
- 5262 E 116th Ave
- 5267 E 115th Ave
- 5259 E 115th Ave
- 11503 Glencoe St
- 5291 E 116th Ave
- 5251 E 116th Ave
- 5252 E 116th Ave
- 5233 E 115th Ave
- 11520 Glencoe St
- 5301 E 116th Ave
- 11532 Glencoe St
- 5241 E 116th Ave
- 5227 E 115th Ave
- 11544 Glencoe St
- 11506 Glencoe St
- 5232 E 116th Ave