Estimated Value: $420,546 - $442,000
3
Beds
2
Baths
1,389
Sq Ft
$311/Sq Ft
Est. Value
About This Home
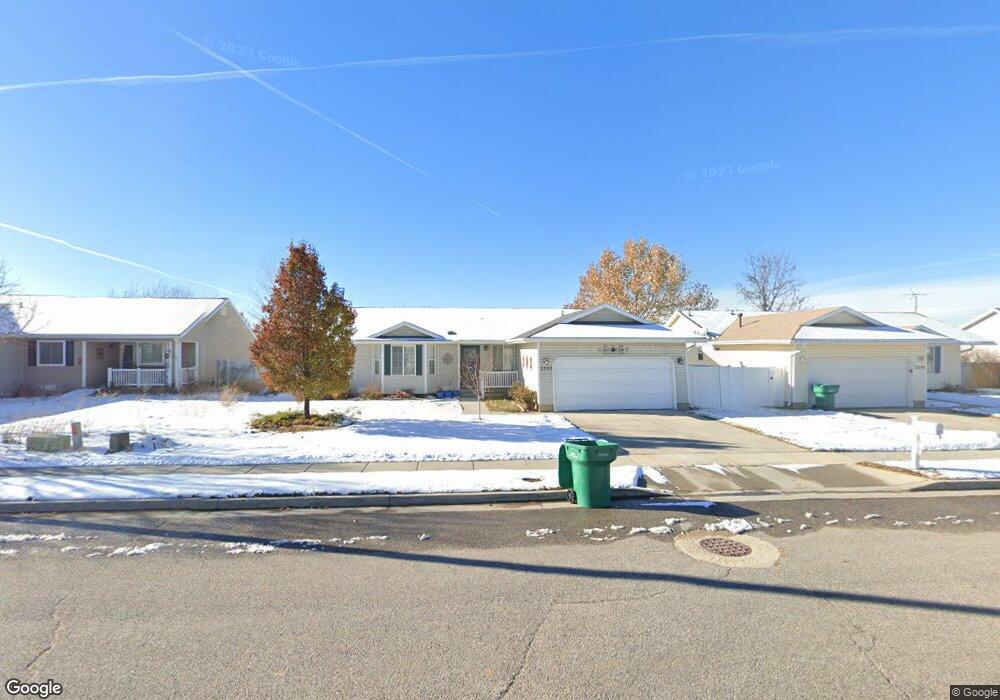
This home is located at 5293 S 4150 W, Roy, UT 84067 and is currently estimated at $431,387, approximately $310 per square foot. 5293 S 4150 W is a home located in Weber County with nearby schools including Country View School, Rocky Mountain Junior High School, and Bridge Elementary School.
Ownership History
Date
Name
Owned For
Owner Type
Purchase Details
Closed on
Sep 18, 2018
Sold by
Christensen Clint M and Christensen Kylee G
Bought by
Robinson Catherine A
Current Estimated Value
Home Financials for this Owner
Home Financials are based on the most recent Mortgage that was taken out on this home.
Original Mortgage
$154,619
Outstanding Balance
$134,559
Interest Rate
4.5%
Mortgage Type
VA
Estimated Equity
$296,828
Purchase Details
Closed on
Sep 25, 2014
Sold by
Czarnecki Laura
Bought by
Christensen Clint M and Smith Kylee G
Home Financials for this Owner
Home Financials are based on the most recent Mortgage that was taken out on this home.
Original Mortgage
$164,350
Interest Rate
4.09%
Mortgage Type
New Conventional
Purchase Details
Closed on
Apr 13, 2001
Sold by
Alpine Homes Inc
Bought by
Czarnecki Laura
Home Financials for this Owner
Home Financials are based on the most recent Mortgage that was taken out on this home.
Original Mortgage
$60,000
Interest Rate
6.98%
Create a Home Valuation Report for This Property
The Home Valuation Report is an in-depth analysis detailing your home's value as well as a comparison with similar homes in the area
Home Values in the Area
Average Home Value in this Area
Purchase History
| Date | Buyer | Sale Price | Title Company |
|---|---|---|---|
| Robinson Catherine A | -- | Backman Title Services | |
| Christensen Clint M | -- | Hickman Land Title Co | |
| Czarnecki Laura | -- | Security Title |
Source: Public Records
Mortgage History
| Date | Status | Borrower | Loan Amount |
|---|---|---|---|
| Open | Robinson Catherine A | $154,619 | |
| Previous Owner | Christensen Clint M | $164,350 | |
| Previous Owner | Czarnecki Laura | $60,000 |
Source: Public Records
Tax History
| Year | Tax Paid | Tax Assessment Tax Assessment Total Assessment is a certain percentage of the fair market value that is determined by local assessors to be the total taxable value of land and additions on the property. | Land | Improvement |
|---|---|---|---|---|
| 2025 | $2,542 | $401,574 | $126,819 | $274,755 |
| 2024 | $2,459 | $215,049 | $69,750 | $145,299 |
| 2023 | $2,515 | $221,650 | $66,315 | $155,335 |
| 2022 | $2,578 | $234,301 | $58,361 | $175,940 |
| 2021 | $2,022 | $300,000 | $80,780 | $219,220 |
| 2020 | $1,960 | $268,000 | $80,780 | $187,220 |
| 2019 | $1,862 | $239,000 | $45,624 | $193,376 |
| 2018 | $1,781 | $215,000 | $42,684 | $172,316 |
| 2017 | $1,651 | $186,000 | $42,684 | $143,316 |
| 2016 | $1,589 | $96,221 | $22,192 | $74,029 |
| 2015 | $1,411 | $86,743 | $22,192 | $64,551 |
| 2014 | $1,311 | $78,903 | $19,471 | $59,432 |
Source: Public Records
Map
Nearby Homes
Your Personal Tour Guide
Ask me questions while you tour the home.