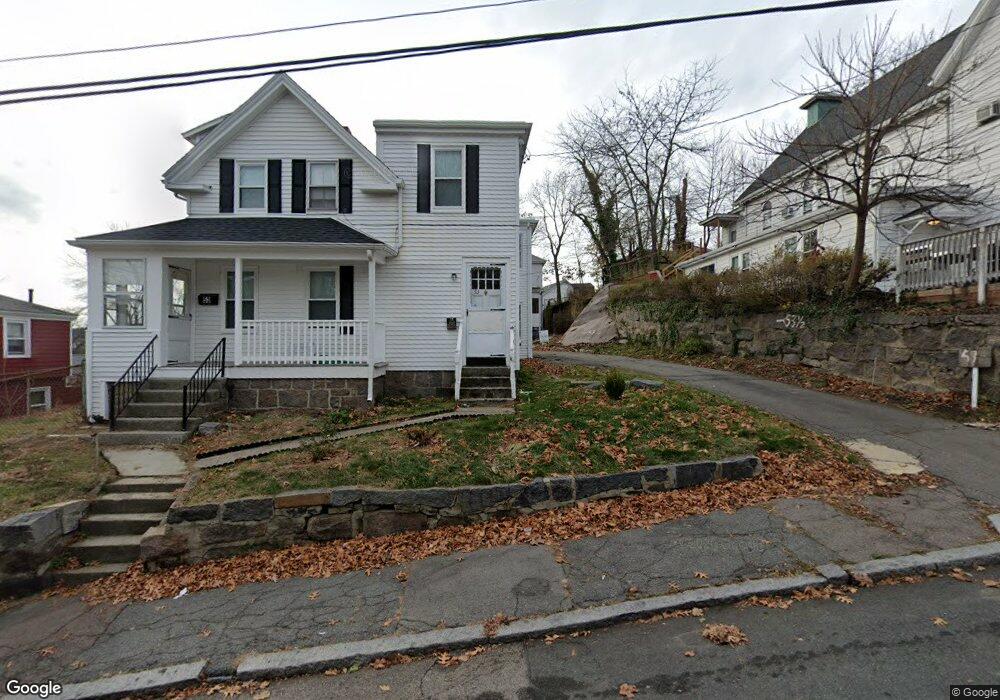
53 1/2 Buckley St Quincy, MA 02169
South Quincy NeighborhoodEstimated Value: $807,000 - $932,000
4
Beds
4
Baths
3,332
Sq Ft
$254/Sq Ft
Est. Value
About This Home
This home is located at 53 1/2 Buckley St, Quincy, MA 02169 and is currently estimated at $847,527, approximately $254 per square foot. 53 1/2 Buckley St is a home located in Norfolk County with nearby schools including Lincoln-Hancock Community School, South West Middle School, and Quincy High School.
Ownership History
Date
Name
Owned For
Owner Type
Purchase Details
Closed on
Aug 7, 2020
Sold by
Figueroa Sandra L and Lin Jackal S
Bought by
Figueroa Sandra L
Current Estimated Value
Purchase Details
Closed on
Aug 29, 1997
Sold by
Ferrara Michael C and Ferrara Michelle M
Bought by
Lam Yong K
Create a Home Valuation Report for This Property
The Home Valuation Report is an in-depth analysis detailing your home's value as well as a comparison with similar homes in the area
Home Values in the Area
Average Home Value in this Area
Purchase History
| Date | Buyer | Sale Price | Title Company |
|---|---|---|---|
| Figueroa Sandra L | -- | None Available | |
| Lam Yong K | $172,000 | -- |
Source: Public Records
Mortgage History
| Date | Status | Borrower | Loan Amount |
|---|---|---|---|
| Previous Owner | Lam Yong K | $252,000 | |
| Previous Owner | Lam Yong K | $179,200 |
Source: Public Records
Tax History Compared to Growth
Tax History
| Year | Tax Paid | Tax Assessment Tax Assessment Total Assessment is a certain percentage of the fair market value that is determined by local assessors to be the total taxable value of land and additions on the property. | Land | Improvement |
|---|---|---|---|---|
| 2025 | $8,548 | $741,400 | $310,300 | $431,100 |
| 2024 | $8,001 | $709,900 | $295,500 | $414,400 |
| 2023 | $7,580 | $681,000 | $268,700 | $412,300 |
| 2022 | $7,842 | $654,600 | $223,900 | $430,700 |
| 2021 | $7,093 | $584,300 | $223,900 | $360,400 |
| 2020 | $7,115 | $572,400 | $223,900 | $348,500 |
| 2019 | $6,949 | $553,700 | $211,300 | $342,400 |
| 2018 | $6,722 | $503,900 | $195,700 | $308,200 |
| 2017 | $6,548 | $462,100 | $177,000 | $285,100 |
| 2016 | $5,961 | $415,100 | $154,000 | $261,100 |
| 2015 | $5,728 | $392,300 | $154,000 | $238,300 |
| 2014 | $5,321 | $358,100 | $154,000 | $204,100 |
Source: Public Records
Map
Nearby Homes
- 57 Buckley St
- 46-48 Buckley St
- 46 Suomi Rd
- 46 Suomi Rd Unit 46
- 14 Arthur Ave
- 12 Arthur Ave
- 42 West St
- 21 Arthur St
- 211 Copeland St
- 91 Garfield St
- 64 Garfield St Unit B
- 1 Cityview Ln Unit 506
- 1 Cityview Ln Unit 210
- 1 Cityview Ln Unit 709
- 1 Cityview Ln Unit 204
- 510 Willard St
- 211 West St Unit 12B
- 25 Carrolls Ln
- 94 Brook Rd Unit 3
- 76 Scotch Pond Place Unit 76
- 53 Buckley St
- 53 Buckley St Unit 1
- 18 Morton St
- 10 Morton St
- 10 Morton St
- 26 Morton St
- 14 Morton St
- 14 Morton St
- 12 Morton St
- 12 Morton St
- 63 Buckley St
- 65 Buckley St Unit 2
- 41 Buckley St
- 52 Buckley St Unit 52
- 48 Buckley St Unit 48
- 30 Morton St
- 44 Buckley St Unit B
- 44 Buckley St Unit A
- 50 Buckley St
- 50 Buckley St Unit 2