Estimated Value: $472,000 - $606,000
2
Beds
1
Bath
872
Sq Ft
$620/Sq Ft
Est. Value
About This Home
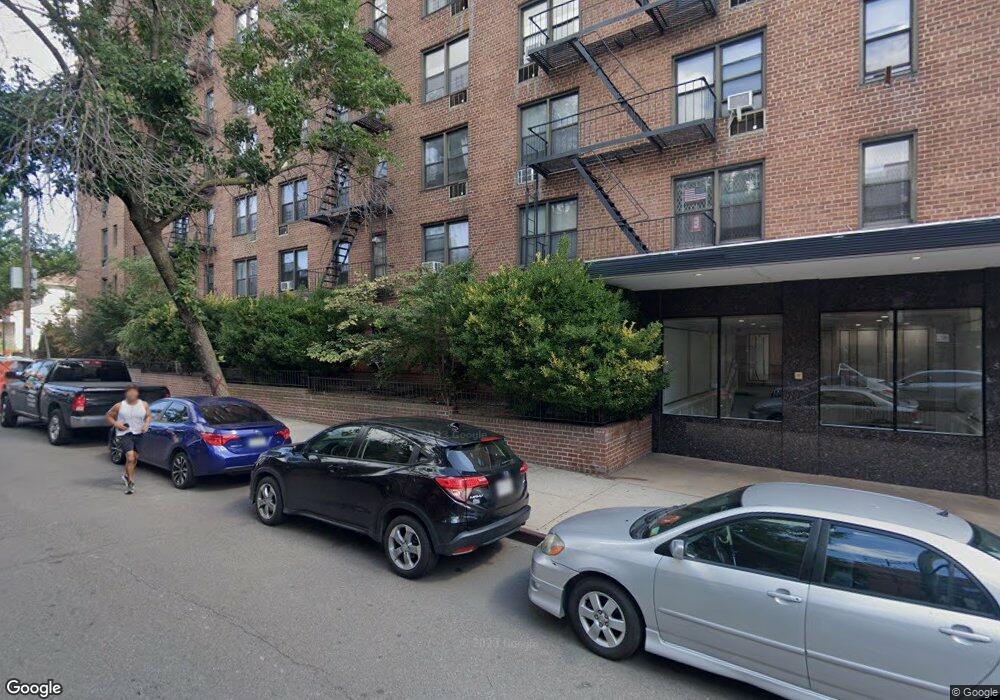
This home is located at 53-11 90th St Unit 5B, Elmhurst, NY 11373 and is currently estimated at $540,900, approximately $620 per square foot. 53-11 90th St Unit 5B is a home located in Queens County with nearby schools including P.S. 13 Clement C Moore, IS 73 - The Frank Sansivieri School, and Newtown High School.
Ownership History
Date
Name
Owned For
Owner Type
Purchase Details
Closed on
Aug 24, 2016
Sold by
Sangprakran Soonthorn and Udomsri Nongkran
Bought by
Bobbyleki Llc
Current Estimated Value
Purchase Details
Closed on
Sep 1, 2015
Sold by
Abalos Zenaida Igama and Deleon Danilo A
Bought by
Sangprakran Soonthorn and Udomsri Nongkran
Purchase Details
Closed on
Mar 23, 2006
Sold by
Belitsis Elaine and Selearis Michael
Bought by
Abalos Zenaida Igama and Deleon Danilo
Home Financials for this Owner
Home Financials are based on the most recent Mortgage that was taken out on this home.
Original Mortgage
$211,400
Interest Rate
6.26%
Mortgage Type
Purchase Money Mortgage
Purchase Details
Closed on
Jan 26, 2006
Sold by
Empress Elena Associates Llc
Bought by
Belitsis Elaine and Selearis Michael
Home Financials for this Owner
Home Financials are based on the most recent Mortgage that was taken out on this home.
Original Mortgage
$211,400
Interest Rate
6.26%
Mortgage Type
Purchase Money Mortgage
Create a Home Valuation Report for This Property
The Home Valuation Report is an in-depth analysis detailing your home's value as well as a comparison with similar homes in the area
Home Values in the Area
Average Home Value in this Area
Purchase History
| Date | Buyer | Sale Price | Title Company |
|---|---|---|---|
| Bobbyleki Llc | -- | -- | |
| Sangprakran Soonthorn | $455,000 | -- | |
| Abalos Zenaida Igama | $302,000 | -- | |
| Belitsis Elaine | $211,540 | -- |
Source: Public Records
Mortgage History
| Date | Status | Borrower | Loan Amount |
|---|---|---|---|
| Previous Owner | Abalos Zenaida Igama | $211,400 |
Source: Public Records
Tax History Compared to Growth
Tax History
| Year | Tax Paid | Tax Assessment Tax Assessment Total Assessment is a certain percentage of the fair market value that is determined by local assessors to be the total taxable value of land and additions on the property. | Land | Improvement |
|---|---|---|---|---|
| 2025 | $5,037 | $41,855 | $3,425 | $38,430 |
| 2024 | $5,037 | $40,288 | $3,425 | $36,863 |
| 2023 | $5,014 | $40,107 | $3,425 | $36,682 |
| 2022 | $4,797 | $42,047 | $3,425 | $38,622 |
| 2021 | $4,590 | $37,420 | $3,425 | $33,995 |
| 2020 | $4,841 | $43,320 | $3,425 | $39,895 |
| 2019 | $4,628 | $41,744 | $3,425 | $38,319 |
| 2018 | $4,484 | $35,255 | $3,426 | $31,829 |
| 2017 | $4,232 | $33,276 | $3,426 | $29,850 |
| 2016 | $4,121 | $33,276 | $3,426 | $29,850 |
| 2015 | $2,608 | $29,601 | $3,425 | $26,176 |
| 2014 | $2,608 | $28,091 | $3,425 | $24,666 |
Source: Public Records
About This Building
Map
Nearby Homes
- 53-11 90th St
- 53-11 90th St Unit 1F
- 53-11 90th St Unit 3D
- 87-86 52nd Ave
- 87-66 52nd Ave
- 88-27 53rd Ave Unit 2R
- 8808 Justice Ave Unit 13M
- 8808 Justice Ave Unit 15M
- 8808 Justice Ave Unit 16H
- 9052 52nd Ave
- 54-08 92nd St
- 5214 92nd St
- 8715 Justice Ave
- 88-08 Justice Ave Unit 15N
- 90-59 56th Ave Unit 2J
- 90-59 56th Ave Unit 9M
- 90-59 56th Ave Unit 2G
- 87-10 51st Ave Unit 3S
- 87-10 51st Ave Unit 6W
- 87-10 51st Ave Unit 3E
- 53-11 90th St Unit 7
- 53-11 90th St Unit 6L
- 53-11 90th St Unit 3K
- 53-11 90th St Unit 4B
- 53-11 90th St Unit 6M
- 53-11 90th St Unit 7C
- 53-11 90th St Unit 7K
- 53-11 90th St Unit 5J
- 53-11 90th St Unit 1-C
- 53-11 90th St Unit 5-K
- 53-11 90th St Unit 5C
- 53-11 90th St Unit 3J
- 53-11 90th St Unit 6C
- 53-11 90th St Unit 2D
- 53-11 90th St Unit 3-B
- 53-11 90th St Unit 4H
- 53-11 90th St Unit 5D
- 53-11 90th St Unit 4D
- 53-11 90th St Unit 3F
- 53-11 90th St Unit 4E