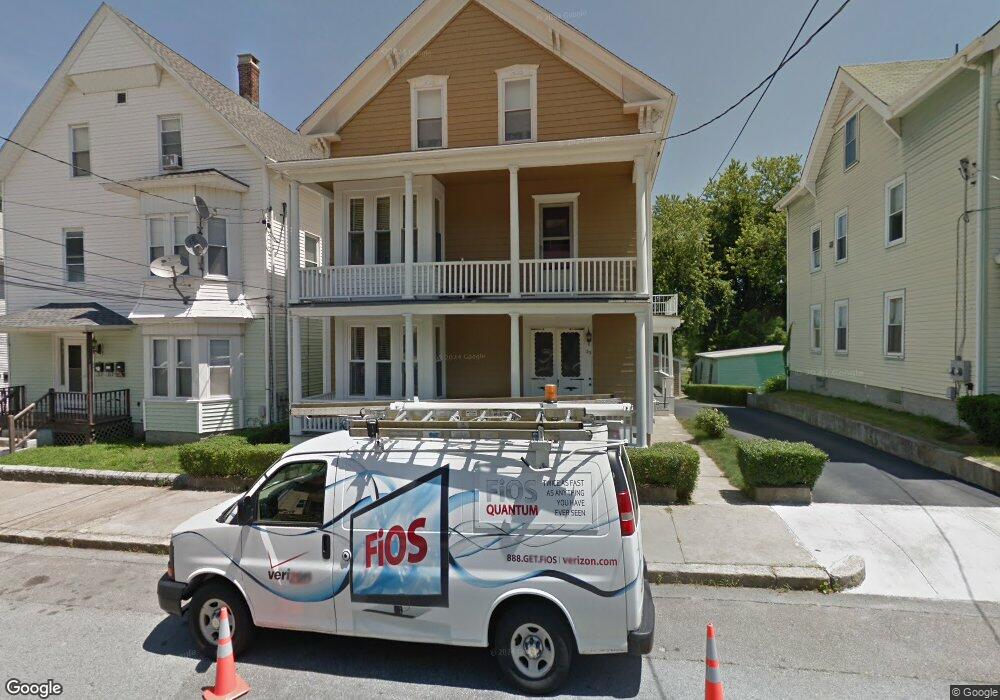
53 1st Ave Woonsocket, RI 02895
Fairmount NeighborhoodEstimated Value: $472,000 - $546,000
4
Beds
2
Baths
2,708
Sq Ft
$186/Sq Ft
Est. Value
About This Home
This home is located at 53 1st Ave, Woonsocket, RI 02895 and is currently estimated at $504,763, approximately $186 per square foot. 53 1st Ave is a home located in Providence County with nearby schools including Woonsocket High School, Rise Prep Mayoral Academy Middle School, and Rise Prep Mayoral Academy.
Ownership History
Date
Name
Owned For
Owner Type
Purchase Details
Closed on
Nov 5, 2012
Sold by
Sitnik Monique H and Sitnik Henry A
Bought by
Sitnik Jr Tr Henry A and Sitnik Monique H
Current Estimated Value
Purchase Details
Closed on
Jan 1, 1987
Bought by
Sitnik Ft
Create a Home Valuation Report for This Property
The Home Valuation Report is an in-depth analysis detailing your home's value as well as a comparison with similar homes in the area
Home Values in the Area
Average Home Value in this Area
Purchase History
| Date | Buyer | Sale Price | Title Company |
|---|---|---|---|
| Sitnik Jr Tr Henry A | -- | -- | |
| Sitnik Jr Tr Henry A | -- | -- | |
| Sitnik Ft | -- | -- |
Source: Public Records
Tax History
| Year | Tax Paid | Tax Assessment Tax Assessment Total Assessment is a certain percentage of the fair market value that is determined by local assessors to be the total taxable value of land and additions on the property. | Land | Improvement |
|---|---|---|---|---|
| 2025 | $4,977 | $443,200 | $89,700 | $353,500 |
| 2024 | $4,342 | $298,600 | $91,300 | $207,300 |
| 2023 | $4,174 | $298,600 | $91,300 | $207,300 |
| 2022 | $4,174 | $298,600 | $91,300 | $207,300 |
| 2021 | $3,741 | $157,500 | $37,200 | $120,300 |
| 2020 | $3,780 | $157,500 | $37,200 | $120,300 |
| 2018 | $3,793 | $157,500 | $37,200 | $120,300 |
| 2017 | $4,021 | $133,600 | $40,700 | $92,900 |
| 2016 | $4,254 | $133,600 | $40,700 | $92,900 |
| 2015 | $4,887 | $133,600 | $40,700 | $92,900 |
| 2014 | $4,715 | $131,200 | $44,900 | $86,300 |
Source: Public Records
Map
Nearby Homes
- 123 4th Ave
- 83 4th Ave
- 36 Fairmount St
- 0 Holbrook Ln Unit 1402850
- 372 River St
- 120 East St
- 435 S Main St
- 0 10th Ave
- 10 10th Ave
- 308 Harris Ave
- 190 Coe St
- 115 Railroad St
- 84 Bernice Ave
- 42 Transit St
- 43 Summit St
- 99 Allen St Unit 205
- 379 Front St
- 180 Allen St Unit 104
- 107 Blackstone St
- 184 Avenue C Unit 2
Your Personal Tour Guide
Ask me questions while you tour the home.