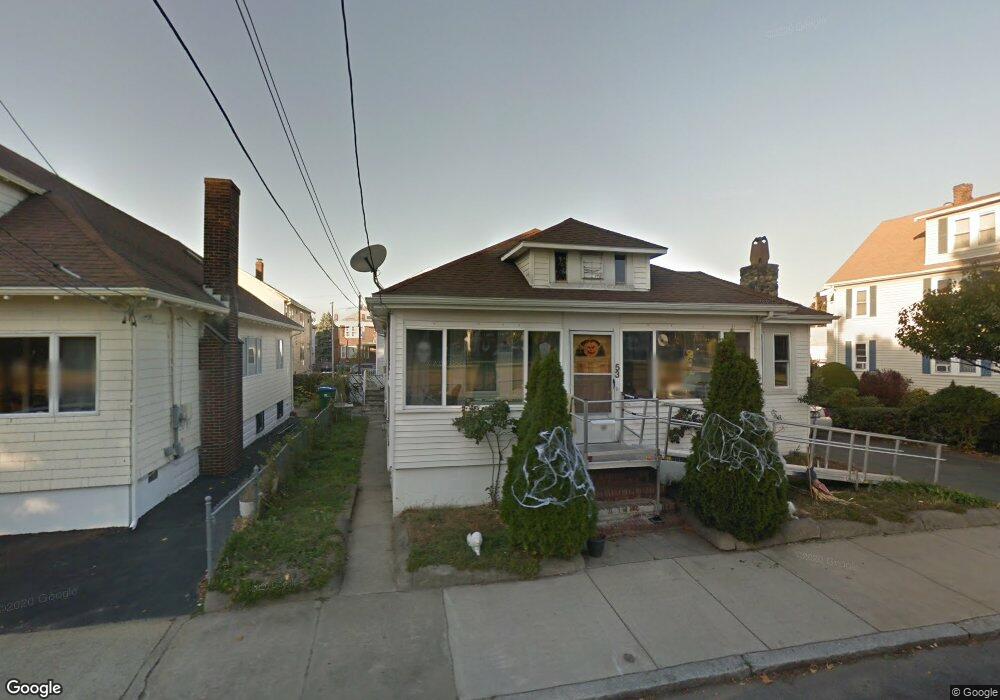
53 2nd St Medford, MA 02155
Wellington NeighborhoodEstimated Value: $711,460 - $853,000
2
Beds
1
Bath
1,396
Sq Ft
$555/Sq Ft
Est. Value
About This Home
This home is located at 53 2nd St, Medford, MA 02155 and is currently estimated at $775,365, approximately $555 per square foot. 53 2nd St is a home located in Middlesex County with nearby schools including Medford High School and Mystic Valley Regional Charter School.
Ownership History
Date
Name
Owned For
Owner Type
Purchase Details
Closed on
Jun 21, 2004
Sold by
Tranfaglia Carmine and Tranfaglia Maria
Bought by
Tranfaglia Carmine and Altieri Katia Jessica
Current Estimated Value
Purchase Details
Closed on
Jun 30, 1993
Sold by
Macdonald Ronald A and Macdonald Marie A
Bought by
Tranfaglia Carmine and Tranfaglia Maria
Home Financials for this Owner
Home Financials are based on the most recent Mortgage that was taken out on this home.
Original Mortgage
$30,000
Interest Rate
7.46%
Mortgage Type
Purchase Money Mortgage
Create a Home Valuation Report for This Property
The Home Valuation Report is an in-depth analysis detailing your home's value as well as a comparison with similar homes in the area
Home Values in the Area
Average Home Value in this Area
Purchase History
| Date | Buyer | Sale Price | Title Company |
|---|---|---|---|
| Tranfaglia Carmine | -- | -- | |
| Tranfaglia Carmine | $130,000 | -- |
Source: Public Records
Mortgage History
| Date | Status | Borrower | Loan Amount |
|---|---|---|---|
| Previous Owner | Tranfaglia Carmine | $30,000 | |
| Previous Owner | Tranfaglia Carmine | $50,000 |
Source: Public Records
Tax History Compared to Growth
Tax History
| Year | Tax Paid | Tax Assessment Tax Assessment Total Assessment is a certain percentage of the fair market value that is determined by local assessors to be the total taxable value of land and additions on the property. | Land | Improvement |
|---|---|---|---|---|
| 2025 | $5,314 | $603,900 | $328,500 | $275,400 |
| 2024 | $5,043 | $591,900 | $312,800 | $279,100 |
| 2023 | $4,943 | $571,500 | $292,400 | $279,100 |
| 2022 | $4,523 | $502,000 | $265,800 | $236,200 |
| 2021 | $4,374 | $464,800 | $253,100 | $211,700 |
| 2020 | $4,119 | $448,700 | $250,500 | $198,200 |
| 2019 | $3,868 | $402,900 | $215,700 | $187,200 |
| 2018 | $3,612 | $352,700 | $196,100 | $156,600 |
| 2017 | $3,387 | $320,700 | $183,300 | $137,400 |
| 2016 | $3,212 | $287,000 | $166,600 | $120,400 |
| 2015 | $3,215 | $274,800 | $158,700 | $116,100 |
Source: Public Records
Map
Nearby Homes
- 57 1st St Unit 2
- 82 2nd St
- 99 4th St Unit 1
- 547 - 549 Riverside Ave
- 320 Middlesex Ave Unit B109
- 320 Middlesex Ave Unit A406
- 320 Middlesex Ave Unit B205
- 320 Middlesex Ave Unit A208
- 830 Fellsway
- 8 Ninth St Unit 303
- 8 9th St Unit 406
- 22 9th St Unit 204
- 74 Highland Ave
- 114 Lawrence St
- 63 Malden St
- 171 Bell Rock St Unit 171
- 165 Bell Rock St
- 186 West St
- 81 Everett St
- 216 Central Ave Unit 218