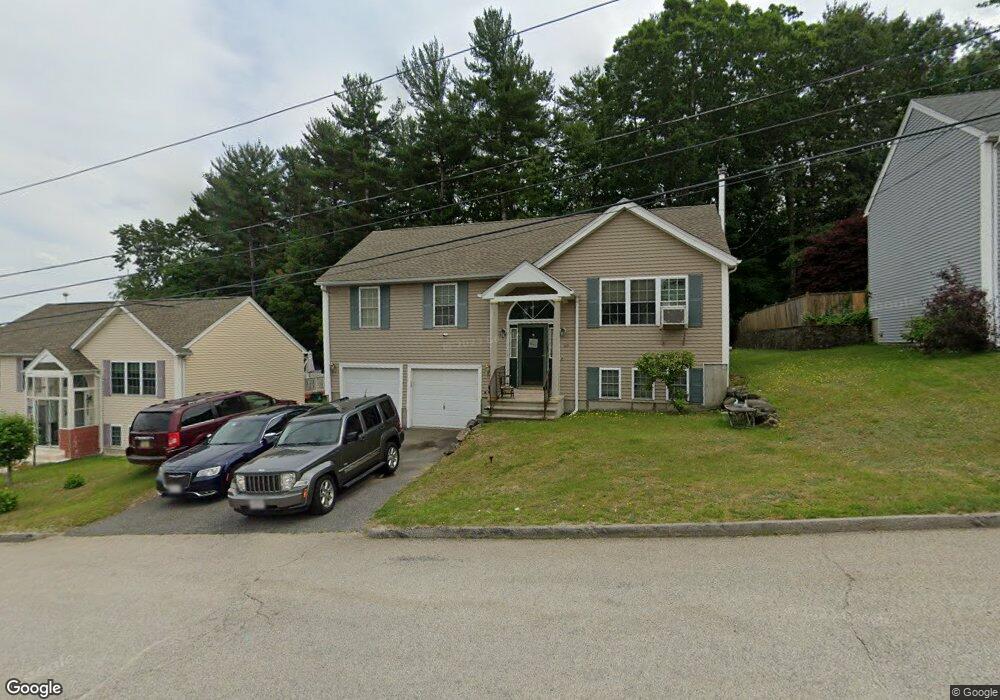
53 3rd St Worcester, MA 01602
Webster Square NeighborhoodEstimated Value: $402,000 - $459,000
3
Beds
2
Baths
1,056
Sq Ft
$401/Sq Ft
Est. Value
About This Home
This home is located at 53 3rd St, Worcester, MA 01602 and is currently estimated at $423,522, approximately $401 per square foot. 53 3rd St is a home located in Worcester County with nearby schools including Tatnuck Magnet School, Chandler Magnet, and Jacob Hiatt Magnet School.
Ownership History
Date
Name
Owned For
Owner Type
Purchase Details
Closed on
Feb 29, 2000
Sold by
Harrington Thomas
Bought by
Thomas Raymond E
Current Estimated Value
Home Financials for this Owner
Home Financials are based on the most recent Mortgage that was taken out on this home.
Original Mortgage
$109,155
Interest Rate
8.15%
Mortgage Type
Purchase Money Mortgage
Purchase Details
Closed on
Oct 17, 1995
Sold by
G Rt
Bought by
Nli Lf Ii Lp
Create a Home Valuation Report for This Property
The Home Valuation Report is an in-depth analysis detailing your home's value as well as a comparison with similar homes in the area
Home Values in the Area
Average Home Value in this Area
Purchase History
| Date | Buyer | Sale Price | Title Company |
|---|---|---|---|
| Thomas Raymond E | $114,900 | -- | |
| Nli Lf Ii Lp | $365,000 | -- | |
| Thomas Raymond E | $114,900 | -- |
Source: Public Records
Mortgage History
| Date | Status | Borrower | Loan Amount |
|---|---|---|---|
| Open | Nli Lf Ii Lp | $111,500 | |
| Closed | Nli Lf Ii Lp | $110,100 | |
| Closed | Nli Lf Ii Lp | $109,155 |
Source: Public Records
Tax History
| Year | Tax Paid | Tax Assessment Tax Assessment Total Assessment is a certain percentage of the fair market value that is determined by local assessors to be the total taxable value of land and additions on the property. | Land | Improvement |
|---|---|---|---|---|
| 2025 | $5,273 | $399,800 | $97,600 | $302,200 |
| 2024 | $5,118 | $372,200 | $97,600 | $274,600 |
| 2023 | $5,008 | $349,200 | $84,800 | $264,400 |
| 2022 | $4,347 | $285,800 | $67,900 | $217,900 |
| 2021 | $4,243 | $260,600 | $54,300 | $206,300 |
| 2020 | $4,070 | $239,400 | $53,900 | $185,500 |
| 2019 | $3,946 | $219,200 | $47,000 | $172,200 |
| 2018 | $3,962 | $209,500 | $47,000 | $162,500 |
| 2017 | $3,784 | $196,900 | $47,000 | $149,900 |
| 2016 | $3,749 | $181,900 | $33,200 | $148,700 |
| 2015 | $3,651 | $181,900 | $33,200 | $148,700 |
| 2014 | $3,554 | $181,900 | $33,200 | $148,700 |
Source: Public Records
Map
Nearby Homes
- 34 Scandinavia Ave
- 5 Swan Ave Unit B
- 215 Mill St Unit 113
- 215 Mill St Unit 115
- 415 Mill St
- 66 Ledgecrest Dr
- 11 Timrod Dr
- 34 Rosslare Dr Unit 108
- 38 Glendale St
- 443 Mill St
- 37 Gates Rd
- 45 Circuit Ave E
- 56 Goddard Memorial Dr
- 15 Circuit Ave E
- 27 Montague St
- 60 Circuit Ave S
- 32 Goddard Memorial Dr
- 9 Englewood Ave
- 10 Minthorne St
- 13 Merchant St
Your Personal Tour Guide
Ask me questions while you tour the home.