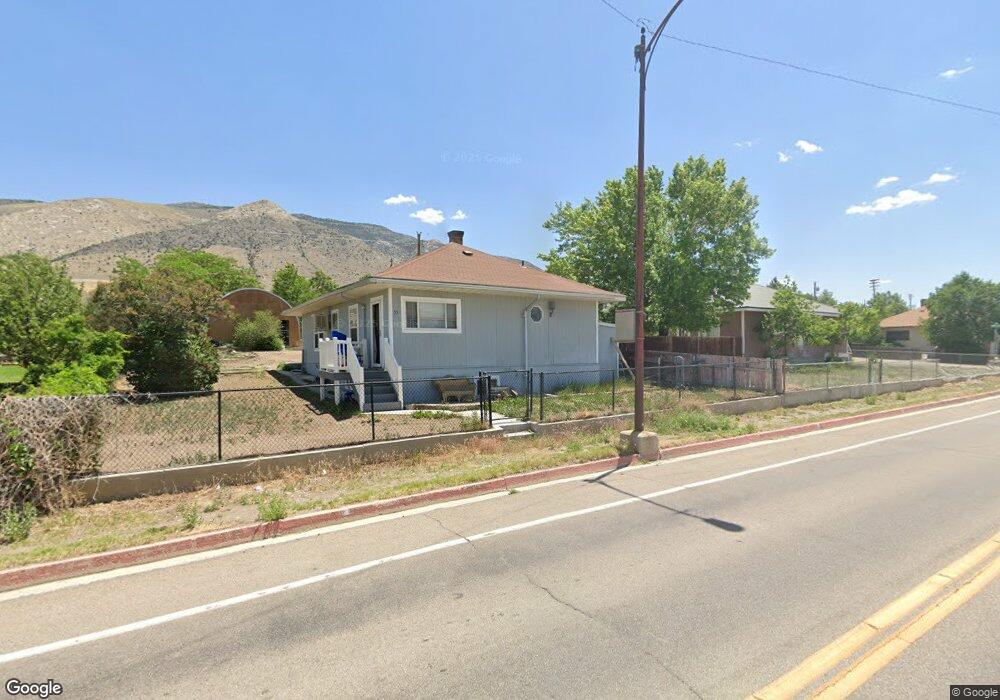
53 4th St Mc Gill, NV 89318
Estimated Value: $126,000 - $217,000
3
Beds
2
Baths
1,107
Sq Ft
$149/Sq Ft
Est. Value
About This Home
This home is located at 53 4th St, Mc Gill, NV 89318 and is currently estimated at $165,082, approximately $149 per square foot. 53 4th St is a home located in White Pine County with nearby schools including McGill Elementary School, White Pine Middle School, and White Pine High School.
Ownership History
Date
Name
Owned For
Owner Type
Purchase Details
Closed on
Nov 10, 2017
Sold by
Bauman Matthew B and Bauman Mckenzie A
Bought by
Gubbine Dominique J and Gubbine James
Current Estimated Value
Home Financials for this Owner
Home Financials are based on the most recent Mortgage that was taken out on this home.
Original Mortgage
$70,000
Outstanding Balance
$58,734
Interest Rate
3.9%
Mortgage Type
New Conventional
Estimated Equity
$106,348
Purchase Details
Closed on
Apr 20, 2017
Sold by
Bauman Matthew D and Bauman Mckenzie A
Bought by
Bauman Matthew D and Bauman Mckenzie A
Purchase Details
Closed on
Jun 27, 2014
Sold by
Munson Dick A and Munson Patty Diane
Bought by
Bauman Matthew D and Bauman Mckenzie A
Home Financials for this Owner
Home Financials are based on the most recent Mortgage that was taken out on this home.
Original Mortgage
$76,000
Interest Rate
4.07%
Mortgage Type
New Conventional
Create a Home Valuation Report for This Property
The Home Valuation Report is an in-depth analysis detailing your home's value as well as a comparison with similar homes in the area
Purchase History
We collect this data history from publicly available records. To have your information removed, we recommend requesting removal directly through your county’s website.
| Date | Buyer | Sale Price | Title Company |
|---|---|---|---|
| Gubbine Dominique J | $84,000 | Stewart Title Company | |
| Bauman Matthew D | $48,154 | None Available | |
| Bauman Matthew D | $80,000 | Stewart Title Company |
Source: Public Records
Mortgage History
We collect this data history from publicly available records. To have your information removed, we recommend requesting removal directly through your county’s website.
| Date | Status | Borrower | Loan Amount |
|---|---|---|---|
| Open | Gubbine Dominique J | $70,000 | |
| Previous Owner | Bauman Matthew D | $76,000 |
Source: Public Records
Tax History
| Year | Tax Paid | Tax Assessment Tax Assessment Total Assessment is a certain percentage of the fair market value that is determined by local assessors to be the total taxable value of land and additions on the property. | Land | Improvement |
|---|---|---|---|---|
| 2025 | $831 | $26,897 | $2,637 | $24,260 |
| 2024 | $831 | $25,740 | $2,637 | $23,103 |
| 2023 | $831 | $22,782 | $2,314 | $20,468 |
| 2022 | $718 | $20,256 | $2,314 | $17,942 |
| 2021 | $667 | $19,133 | $2,314 | $16,819 |
| 2020 | $624 | $17,947 | $2,125 | $15,822 |
| 2019 | $581 | $17,392 | $2,125 | $15,267 |
| 2018 | $545 | $16,855 | $2,125 | $14,730 |
| 2017 | $512 | $16,753 | $2,125 | $14,628 |
| 2016 | $498 | $11,653 | $2,125 | $9,528 |
| 2015 | $280 | $11,559 | $2,125 | $9,434 |
| 2014 | $280 | $11,347 | $2,098 | $9,249 |
Source: Public Records
Map
Nearby Homes
Your Personal Tour Guide
Ask me questions while you tour the home.