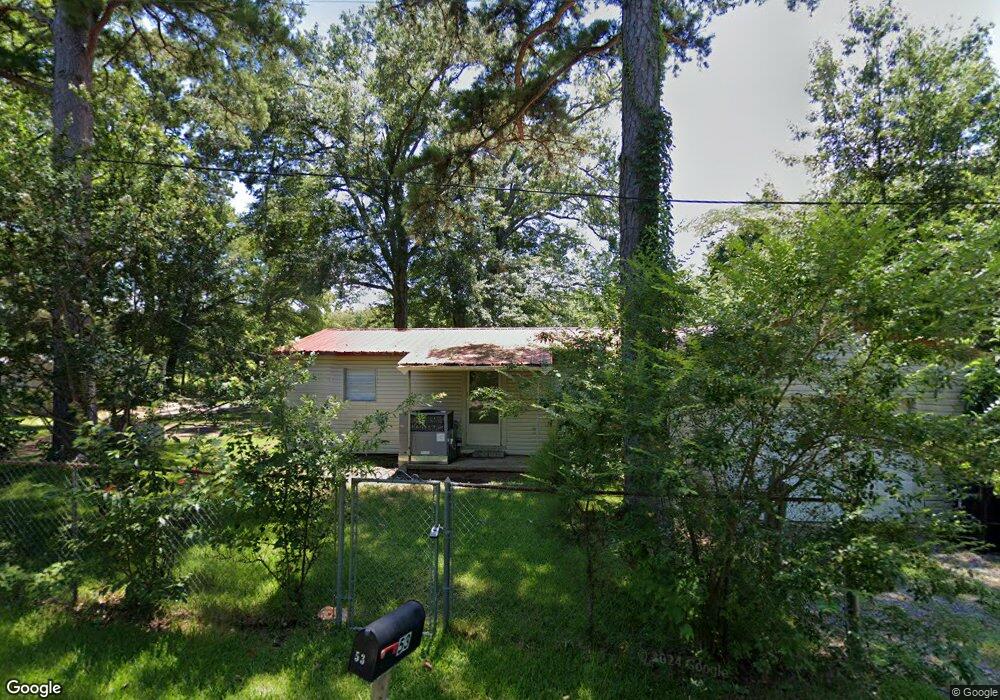
53 Barham Loop Conway, AR 72032
Estimated Value: $102,000 - $124,000
Studio
1
Bath
900
Sq Ft
$120/Sq Ft
Est. Value
About This Home
This home is located at 53 Barham Loop, Conway, AR 72032 and is currently estimated at $108,425, approximately $120 per square foot. 53 Barham Loop is a home located in Faulkner County with nearby schools including Preston & Florence Mattison Elementary School, Bob Courtway Middle School, and Conway Junior High School.
Ownership History
Date
Name
Owned For
Owner Type
Purchase Details
Closed on
Dec 28, 2023
Sold by
Village Capital & Inv Llc
Bought by
Sunridge Village Properties
Current Estimated Value
Purchase Details
Closed on
Apr 12, 2016
Sold by
J D & E Inc Arkansas Corporation
Bought by
Standridge Steve William Ray
Home Financials for this Owner
Home Financials are based on the most recent Mortgage that was taken out on this home.
Original Mortgage
$85,000
Interest Rate
3.64%
Mortgage Type
VA
Purchase Details
Closed on
May 27, 2015
Sold by
Webb Jarrell D and Webb Earline
Bought by
J D & E Inc
Purchase Details
Closed on
May 5, 2010
Sold by
Carter Lenville
Bought by
Webb Jarrel D and Webb Earline
Purchase Details
Closed on
Jun 17, 2003
Bought by
Carter
Purchase Details
Closed on
Apr 12, 1999
Bought by
Alford
Purchase Details
Closed on
Apr 24, 1997
Bought by
Fulmer
Create a Home Valuation Report for This Property
The Home Valuation Report is an in-depth analysis detailing your home's value as well as a comparison with similar homes in the area
Home Values in the Area
Average Home Value in this Area
Purchase History
| Date | Buyer | Sale Price | Title Company |
|---|---|---|---|
| Sunridge Village Properties | $123,000 | Netco Title | |
| Standridge Steve William Ray | $85,000 | None Available | |
| J D & E Inc | $73,150 | None Available | |
| Webb Jarrel D | $69,000 | -- | |
| Carter | $70,000 | -- | |
| Alford | $57,000 | -- | |
| Fulmer | $49,000 | -- |
Source: Public Records
Mortgage History
| Date | Status | Borrower | Loan Amount |
|---|---|---|---|
| Previous Owner | Standridge Steve William Ray | $85,000 |
Source: Public Records
Tax History
| Year | Tax Paid | Tax Assessment Tax Assessment Total Assessment is a certain percentage of the fair market value that is determined by local assessors to be the total taxable value of land and additions on the property. | Land | Improvement |
|---|---|---|---|---|
| 2025 | $803 | $22,100 | $3,600 | $18,500 |
| 2024 | $736 | $22,100 | $3,600 | $18,500 |
| 2023 | $670 | $14,430 | $3,600 | $10,830 |
| 2022 | $715 | $14,430 | $3,600 | $10,830 |
| 2021 | $693 | $14,430 | $3,600 | $10,830 |
| 2020 | $30 | $12,980 | $3,600 | $9,380 |
| 2019 | $632 | $12,980 | $3,600 | $9,380 |
| 2018 | $30 | $12,980 | $3,600 | $9,380 |
| 2017 | $632 | $12,980 | $3,600 | $9,380 |
| 2016 | $282 | $12,980 | $3,600 | $9,380 |
| 2015 | $615 | $12,600 | $3,600 | $9,000 |
| 2014 | $615 | $12,600 | $3,600 | $9,000 |
Source: Public Records
Map
Nearby Homes
- 31 Barham Loop
- 20 Canterberry Point Dr
- 98 Waterfront Cove
- 10 Palarm Creek Rd
- 303 Rooster Rd
- 8 Candlelight Dr
- 12 Oak Leaf Dr
- 41 Oak Leaf Dr
- 13 Oak Leaf Dr
- 28 Candlelight Dr
- 285 Rooster Rd
- 15 Brown St
- TBD Priest Ln
- Lot 48 Sierra Sunset Cove
- 132 Daugherty Hill Rd
- Lot 51 7 Lakes Ranch Blvd
- Lot 10 7 Lakes Ranch Blvd
- Lot 4 7 Lakes Ranch Blvd
- Lot 15 7 Lakes Ranch Blvd
- 256 Caney Creek Rd
Your Personal Tour Guide
Ask me questions while you tour the home.