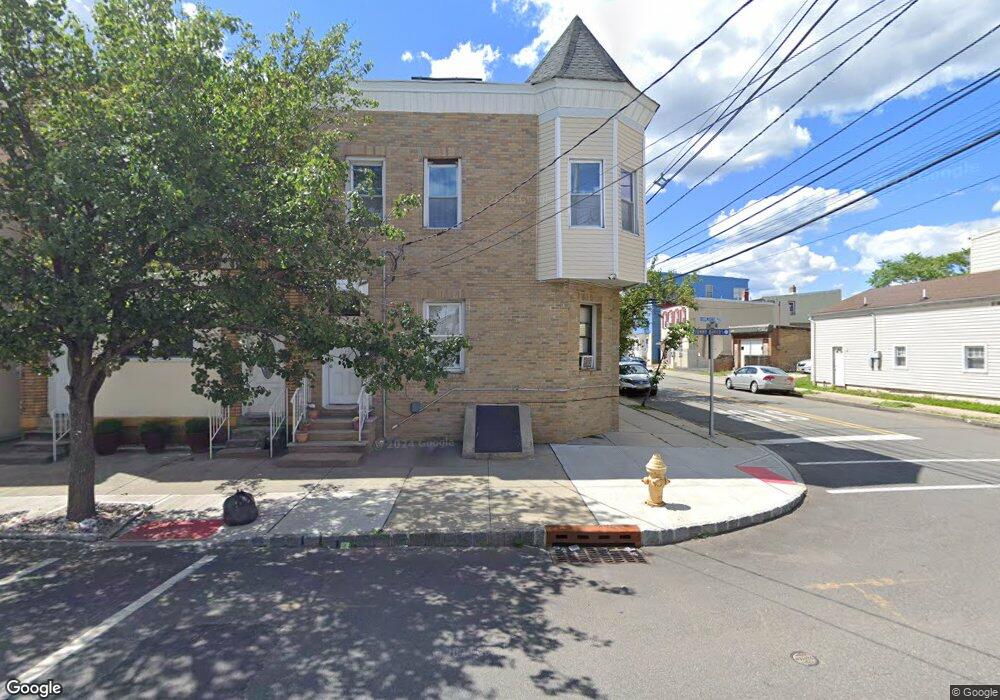
53 Belmont Ave Belleville, NJ 07109
Estimated Value: $592,807 - $740,000
6
Beds
3
Baths
2,344
Sq Ft
$286/Sq Ft
Est. Value
About This Home
This home is located at 53 Belmont Ave, Belleville, NJ 07109 and is currently estimated at $669,702, approximately $285 per square foot. 53 Belmont Ave is a home located in Essex County with nearby schools including Belleville High School and Jamas Children's University.
Ownership History
Date
Name
Owned For
Owner Type
Purchase Details
Closed on
Sep 2, 2003
Sold by
Martinez Mel
Bought by
America Medieta
Current Estimated Value
Purchase Details
Closed on
Feb 29, 2000
Sold by
Roselynd 2000
Bought by
Ortiz Victoria
Home Financials for this Owner
Home Financials are based on the most recent Mortgage that was taken out on this home.
Original Mortgage
$163,651
Interest Rate
8.31%
Mortgage Type
FHA
Purchase Details
Closed on
Mar 31, 1997
Sold by
Swanson G
Bought by
Liptak Christine
Home Financials for this Owner
Home Financials are based on the most recent Mortgage that was taken out on this home.
Original Mortgage
$115,000
Interest Rate
7.85%
Purchase Details
Closed on
Mar 14, 1997
Sold by
Brent Mgt
Bought by
Swanson Gregory
Home Financials for this Owner
Home Financials are based on the most recent Mortgage that was taken out on this home.
Original Mortgage
$115,000
Interest Rate
7.85%
Purchase Details
Closed on
Oct 25, 1996
Sold by
Source 1 Mtg
Bought by
Mylan Donald
Create a Home Valuation Report for This Property
The Home Valuation Report is an in-depth analysis detailing your home's value as well as a comparison with similar homes in the area
Home Values in the Area
Average Home Value in this Area
Purchase History
| Date | Buyer | Sale Price | Title Company |
|---|---|---|---|
| America Medieta | $241,111 | -- | |
| -- | $241,100 | -- | |
| Ortiz Victoria | $176,000 | -- | |
| Liptak Christine | $161,000 | -- | |
| Swanson Gregory | $52,100 | -- | |
| Mylan Donald | $8,000 | -- |
Source: Public Records
Mortgage History
| Date | Status | Borrower | Loan Amount |
|---|---|---|---|
| Previous Owner | Ortiz Victoria | $163,651 | |
| Previous Owner | Liptak Christine | $115,000 |
Source: Public Records
Tax History Compared to Growth
Tax History
| Year | Tax Paid | Tax Assessment Tax Assessment Total Assessment is a certain percentage of the fair market value that is determined by local assessors to be the total taxable value of land and additions on the property. | Land | Improvement |
|---|---|---|---|---|
| 2025 | $9,660 | $246,800 | $52,300 | $194,500 |
| 2024 | $9,660 | $246,800 | $52,300 | $194,500 |
| 2022 | $9,504 | $246,800 | $52,300 | $194,500 |
| 2021 | $9,366 | $246,800 | $52,300 | $194,500 |
| 2020 | $9,238 | $246,800 | $52,300 | $194,500 |
| 2019 | $8,739 | $246,800 | $52,300 | $194,500 |
| 2018 | $7,952 | $198,300 | $45,000 | $153,300 |
| 2017 | $7,688 | $198,300 | $45,000 | $153,300 |
| 2016 | $7,603 | $198,300 | $45,000 | $153,300 |
| 2015 | $7,345 | $198,300 | $45,000 | $153,300 |
| 2014 | $7,149 | $198,300 | $45,000 | $153,300 |
Source: Public Records
Map
Nearby Homes
- 21 Belmont Ave Unit 2
- 47 Belmont Ave
- 49 Belmont Ave
- 21 Belmont Ave
- 51 Belmont Ave
- 45 Belmont Ave
- 25 Belmont Ave
- 19 Belmont Ave
- 33 Belmont Ave
- 35 Belmont Ave
- 39 Belmont Ave
- 19 Belmont Ave Unit 2
- 19 Belmont Ave Unit 1
- 31 Belmont Ave Unit 1
- 2228 Belmont Ave Unit B3
- 2228 Belmont Ave
- 30 Belmont Ave
- 32 Belmont Ave
- 34 Belmont Ave
- 22-28 Belmont Ave Unit C-2