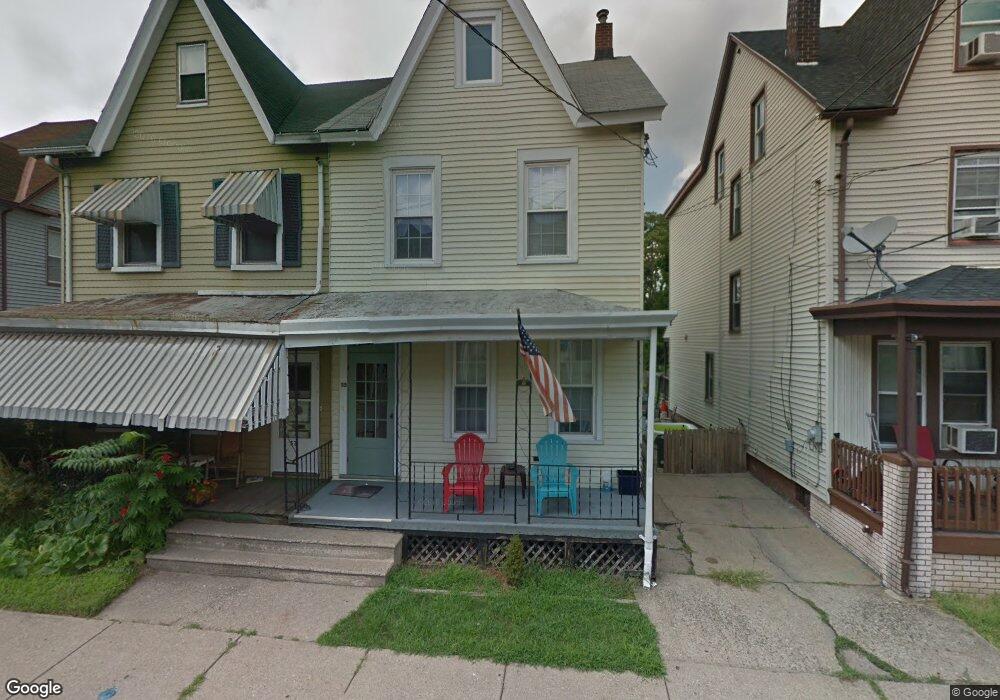
53 Bennett St Phillipsburg, NJ 08865
Estimated Value: $203,000 - $280,000
Studio
--
Bath
1,500
Sq Ft
$157/Sq Ft
Est. Value
About This Home
This home is located at 53 Bennett St, Phillipsburg, NJ 08865 and is currently estimated at $235,838, approximately $157 per square foot. 53 Bennett St is a home located in Warren County with nearby schools including Phillipsburg High School, Easton Arts Academy Elementary Cs, and Saints Philip & James School.
Ownership History
Date
Name
Owned For
Owner Type
Purchase Details
Closed on
Dec 15, 2017
Sold by
Streiguth Donald
Bought by
Lefkowitz David J
Current Estimated Value
Purchase Details
Closed on
Dec 22, 1995
Sold by
Johnson Robin Sue and Johnson Darren James
Bought by
Johnson Robin Sue
Home Financials for this Owner
Home Financials are based on the most recent Mortgage that was taken out on this home.
Original Mortgage
$59,850
Interest Rate
7.31%
Mortgage Type
FHA
Create a Home Valuation Report for This Property
The Home Valuation Report is an in-depth analysis detailing your home's value as well as a comparison with similar homes in the area
Home Values in the Area
Average Home Value in this Area
Purchase History
| Date | Buyer | Sale Price | Title Company |
|---|---|---|---|
| Lefkowitz David J | -- | None Available | |
| Johnson Robin Sue | -- | -- | |
| Johnson Robin S | $59,900 | -- |
Source: Public Records
Mortgage History
| Date | Status | Borrower | Loan Amount |
|---|---|---|---|
| Previous Owner | Johnson Robin S | $59,850 |
Source: Public Records
Tax History
| Year | Tax Paid | Tax Assessment Tax Assessment Total Assessment is a certain percentage of the fair market value that is determined by local assessors to be the total taxable value of land and additions on the property. | Land | Improvement |
|---|---|---|---|---|
| 2025 | $4,436 | $97,600 | $23,300 | $74,300 |
| 2024 | $4,095 | $97,600 | $23,300 | $74,300 |
| 2023 | $4,048 | $97,600 | $23,300 | $74,300 |
| 2022 | $4,048 | $97,600 | $23,300 | $74,300 |
| 2021 | $3,919 | $97,600 | $23,300 | $74,300 |
| 2020 | $3,945 | $97,600 | $23,300 | $74,300 |
| 2019 | $3,885 | $97,600 | $23,300 | $74,300 |
| 2018 | $3,885 | $97,600 | $23,300 | $74,300 |
| 2017 | $3,868 | $97,600 | $23,300 | $74,300 |
| 2016 | $3,808 | $97,600 | $23,300 | $74,300 |
| 2015 | $3,779 | $97,600 | $23,300 | $74,300 |
| 2014 | $3,656 | $97,600 | $23,300 | $74,300 |
Source: Public Records
Map
Nearby Homes
Your Personal Tour Guide
Ask me questions while you tour the home.