
Seller's Agent in 2025
Kathy Kaklamanos
BHG Masiello Nashua
(603) 493-5990
4 in this area
67 Total Sales
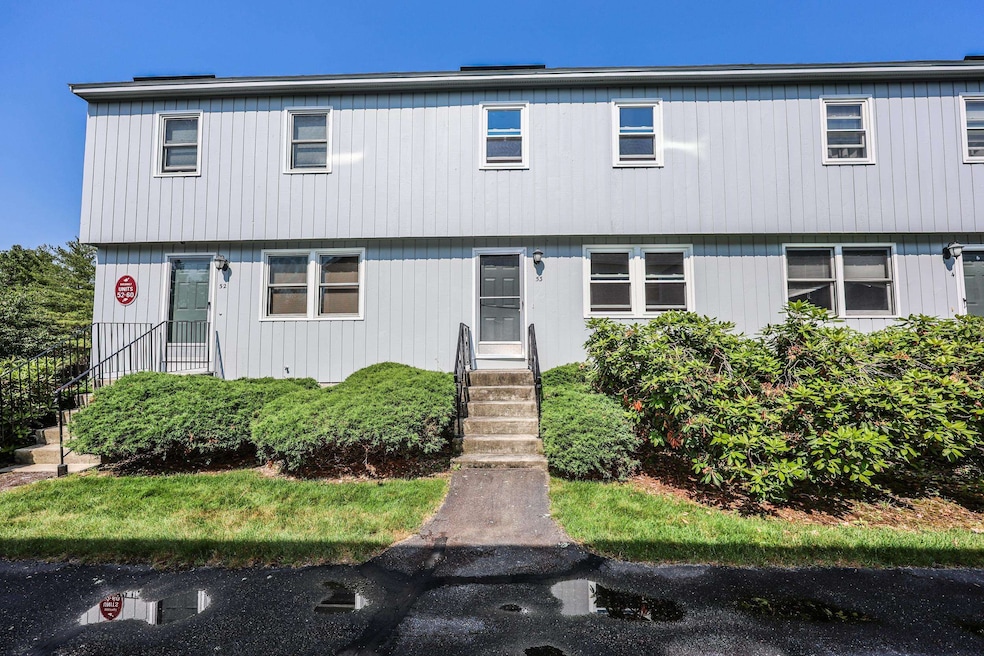


Welcome to 53 Bluestone Drive! This townhouse offers a fantastic combination of style, comfort, and convenience in a prime Nashua location. Featuring five rooms, two spacious bedrooms, and a versatile loft, this home provides ample space for living, working, and entertaining. The updated kitchen boasts granite countertops, stainless steel appliances, shaker-style cabinets, a wine fridge, and a charming pot rack. The open-concept dining and living area, with durable manufactured flooring, leads to a private balcony—perfect for relaxing. The primary bedroom features a vaulted ceiling, creating an airy feel, while the loft offers endless possibilities as a home office, gym, or creative space. A second generously sized bedroom and a full bath complete the upper level. Additional highlights include a 1-car garage with direct entry, an extra private parking space, and a walkout basement with laundry and storage. Bluestone residents enjoy a low-maintenance lifestyle with landscaping, plowing, water, sewer, trash removal, and pool maintenance included in the condo fee. Conveniently located near restaurants, shopping, and major routes, this home is ideal for commuters and those looking for a vibrant community. Don’t miss this opportunity to own instead of renting!
Last Agent to Sell the Property
BHG Masiello Nashua License #002192 Listed on: 06/24/2025
| Date | Type | Sale Price | Title Company |
|---|---|---|---|
| Warranty Deed | $375,000 | -- | |
| Warranty Deed | $375,000 | -- | |
| Warranty Deed | $375,000 | -- | |
| Warranty Deed | $155,000 | -- | |
| Warranty Deed | $155,000 | -- | |
| Deed | $153,000 | -- | |
| Deed | $153,000 | -- | |
| Warranty Deed | $132,900 | -- | |
| Warranty Deed | $132,900 | -- |
| Date | Status | Loan Amount | Loan Type |
|---|---|---|---|
| Open | $290,000 | New Conventional | |
| Closed | $290,000 | New Conventional | |
| Previous Owner | $122,400 | Purchase Money Mortgage | |
| Previous Owner | $129,000 | Purchase Money Mortgage |
| Date | Event | Price | List to Sale | Price per Sq Ft | Prior Sale |
|---|---|---|---|---|---|
| 07/18/2025 07/18/25 | Sold | $375,000 | 0.0% | $296 / Sq Ft | |
| 07/01/2025 07/01/25 | Pending | -- | -- | -- | |
| 06/24/2025 06/24/25 | For Sale | $375,000 | 0.0% | $296 / Sq Ft | |
| 12/09/2019 12/09/19 | Rented | $1,700 | -2.9% | -- | |
| 08/30/2019 08/30/19 | Under Contract | -- | -- | -- | |
| 08/24/2019 08/24/19 | Price Changed | $1,750 | -99.9% | $1 / Sq Ft | |
| 08/24/2019 08/24/19 | For Rent | $1,750,000 | +102841.2% | -- | |
| 10/02/2018 10/02/18 | Rented | $1,700 | 0.0% | -- | |
| 09/21/2018 09/21/18 | For Rent | $1,700 | +6.3% | -- | |
| 04/21/2017 04/21/17 | Rented | $1,600 | 0.0% | -- | |
| 04/21/2017 04/21/17 | For Rent | $1,600 | 0.0% | -- | |
| 12/29/2016 12/29/16 | Sold | $155,000 | -3.1% | $122 / Sq Ft | View Prior Sale |
| 11/21/2016 11/21/16 | Pending | -- | -- | -- | |
| 11/03/2016 11/03/16 | For Sale | $159,900 | -- | $126 / Sq Ft |
| Year | Tax Paid | Tax Assessment Tax Assessment Total Assessment is a certain percentage of the fair market value that is determined by local assessors to be the total taxable value of land and additions on the property. | Land | Improvement |
|---|---|---|---|---|
| 2025 | $5,510 | $327,400 | $0 | $327,400 |
| 2024 | $5,206 | $327,400 | $0 | $327,400 |
| 2023 | $4,928 | $270,300 | $0 | $270,300 |
| 2022 | $4,884 | $270,300 | $0 | $270,300 |
| 2021 | $3,987 | $171,700 | $0 | $171,700 |
| 2020 | $3,882 | $171,700 | $0 | $171,700 |
| 2019 | $3,736 | $171,700 | $0 | $171,700 |
| 2018 | $3,642 | $171,700 | $0 | $171,700 |
| 2017 | $3,170 | $122,900 | $0 | $122,900 |
| 2016 | $3,081 | $122,900 | $0 | $122,900 |
| 2015 | $3,015 | $122,900 | $0 | $122,900 |
| 2014 | $2,956 | $122,900 | $0 | $122,900 |
Seller's Agent in 2025
Kathy Kaklamanos
BHG Masiello Nashua
(603) 493-5990
4 in this area
67 Total Sales
A
Buyer's Agent in 2025
Audrey DeCourcy
Coldwell Banker Realty Nashua
(603) 540-5778
2 in this area
52 Total Sales
A
Buyer's Agent in 2018
Amira Marikar
RE/MAX
C
Seller's Agent in 2017
Carollee Hayward
Triangle Realty Group
Seller's Agent in 2016
Peg Walther
BHHS Verani Londonderry
(603) 845-2500
6 Total Sales
Source: PrimeMLS
MLS Number: 5048287
APN: NASH-000000-000189-000053A
Disclaimer: Certain information contained herein is derived from information provided by parties other than Homes.com. All information provided is deemed reliable, but is not guaranteed to be accurate and should be independently verified.
![]() Copyright 2026 PrimeMLS, Inc. All rights reserved. This information is deemed reliable, but not guaranteed. The data relating to real estate displayed on this display comes in part from the IDX Program of PrimeMLS. The information being provided is for consumers’ personal, non-commercial use and may not be used for any purpose other than to identify prospective properties consumers may be interested in purchasing.
Copyright 2026 PrimeMLS, Inc. All rights reserved. This information is deemed reliable, but not guaranteed. The data relating to real estate displayed on this display comes in part from the IDX Program of PrimeMLS. The information being provided is for consumers’ personal, non-commercial use and may not be used for any purpose other than to identify prospective properties consumers may be interested in purchasing.
Ask me questions while you tour the home.