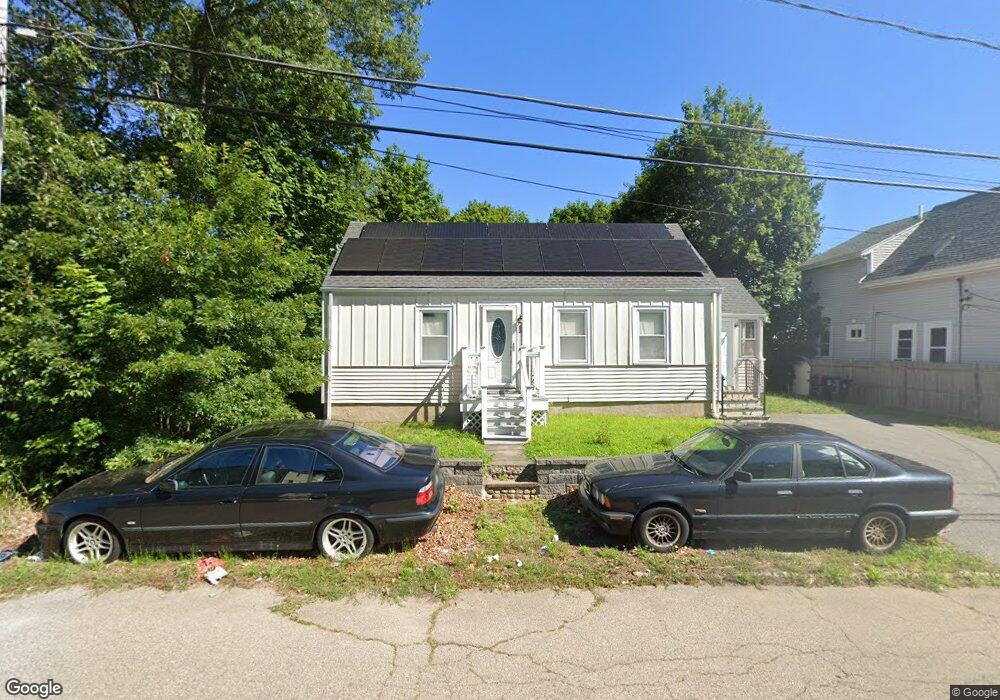
53 Boyden St Brockton, MA 02302
Estimated Value: $413,000 - $431,000
3
Beds
1
Bath
879
Sq Ft
$478/Sq Ft
Est. Value
About This Home
This home is located at 53 Boyden St, Brockton, MA 02302 and is currently estimated at $420,341, approximately $478 per square foot. 53 Boyden St is a home located in Plymouth County with nearby schools including Brookfield Elementary School, Downey Elementary School, and Ashfield Middle School.
Ownership History
Date
Name
Owned For
Owner Type
Purchase Details
Closed on
Jun 24, 2009
Sold by
Fortin Rita D
Bought by
Williams Wayne
Current Estimated Value
Home Financials for this Owner
Home Financials are based on the most recent Mortgage that was taken out on this home.
Original Mortgage
$128,913
Outstanding Balance
$84,137
Interest Rate
5.31%
Estimated Equity
$336,204
Purchase Details
Closed on
Sep 11, 2008
Sold by
Bernabeo Joann and Misciscia Eleanor R
Bought by
Fortin Rita D
Purchase Details
Closed on
May 17, 2005
Sold by
Fortin Rita D and Fortin Albert T
Bought by
Bernabeo Jo-Ann and Miscioscia Eleanor R
Create a Home Valuation Report for This Property
The Home Valuation Report is an in-depth analysis detailing your home's value as well as a comparison with similar homes in the area
Home Values in the Area
Average Home Value in this Area
Purchase History
| Date | Buyer | Sale Price | Title Company |
|---|---|---|---|
| Williams Wayne | $132,900 | -- | |
| Fortin Rita D | -- | -- | |
| Bernabeo Jo-Ann | -- | -- |
Source: Public Records
Mortgage History
| Date | Status | Borrower | Loan Amount |
|---|---|---|---|
| Open | Bernabeo Jo-Ann | $128,913 | |
| Closed | Bernabeo Jo-Ann | $128,913 |
Source: Public Records
Tax History Compared to Growth
Tax History
| Year | Tax Paid | Tax Assessment Tax Assessment Total Assessment is a certain percentage of the fair market value that is determined by local assessors to be the total taxable value of land and additions on the property. | Land | Improvement |
|---|---|---|---|---|
| 2025 | $4,417 | $364,700 | $140,200 | $224,500 |
| 2024 | $4,142 | $344,600 | $140,200 | $204,400 |
| 2023 | $4,026 | $310,200 | $104,900 | $205,300 |
| 2022 | $3,715 | $265,900 | $95,400 | $170,500 |
| 2021 | $3,602 | $248,400 | $79,400 | $169,000 |
| 2020 | $3,497 | $230,800 | $74,200 | $156,600 |
| 2019 | $3,506 | $225,600 | $72,400 | $153,200 |
| 2018 | $2,817 | $175,400 | $72,400 | $103,000 |
| 2017 | $2,739 | $170,100 | $72,400 | $97,700 |
| 2016 | $2,378 | $137,000 | $70,200 | $66,800 |
| 2015 | $2,082 | $114,700 | $70,200 | $44,500 |
| 2014 | $2,156 | $118,900 | $70,200 | $48,700 |
Source: Public Records
Map
Nearby Homes