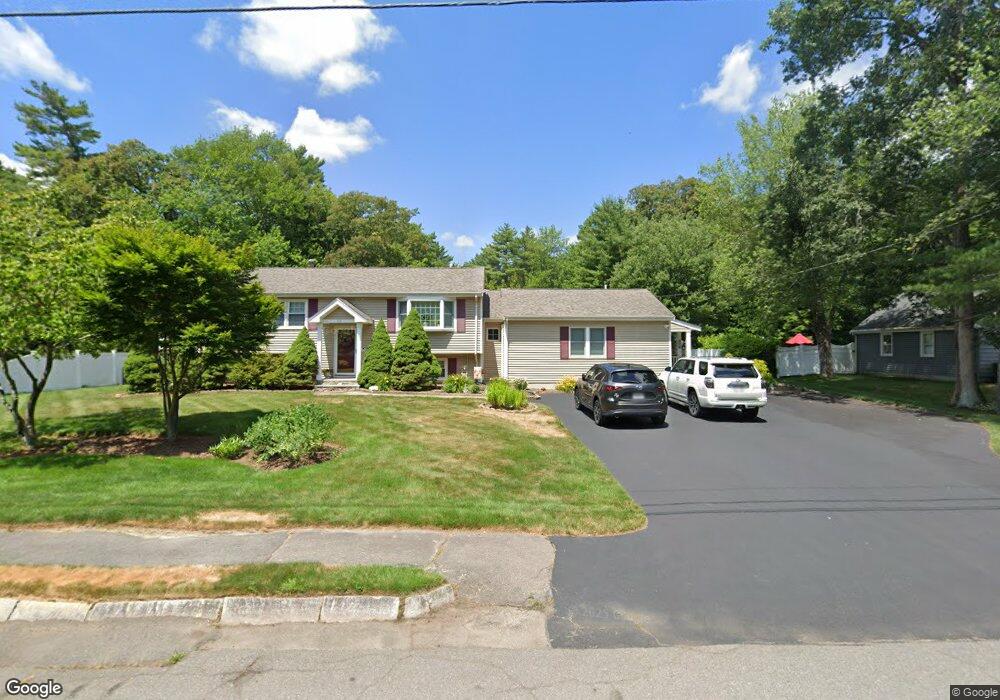
53 Branch Rd East Bridgewater, MA 02333
Estimated Value: $563,000 - $705,000
4
Beds
2
Baths
1,662
Sq Ft
$375/Sq Ft
Est. Value
About This Home
This home is located at 53 Branch Rd, East Bridgewater, MA 02333 and is currently estimated at $622,695, approximately $374 per square foot. 53 Branch Rd is a home located in Plymouth County with nearby schools including Central Elementary School, Gordon W Mitchell Middle School, and East Bridgewater Jr./Sr. High School.
Ownership History
Date
Name
Owned For
Owner Type
Purchase Details
Closed on
Oct 1, 1993
Sold by
Wedge Paul W and Wedge Marilyn J
Bought by
Plunkett Brian E and Plunkett Lisa M
Current Estimated Value
Home Financials for this Owner
Home Financials are based on the most recent Mortgage that was taken out on this home.
Original Mortgage
$117,000
Interest Rate
7%
Mortgage Type
Purchase Money Mortgage
Create a Home Valuation Report for This Property
The Home Valuation Report is an in-depth analysis detailing your home's value as well as a comparison with similar homes in the area
Home Values in the Area
Average Home Value in this Area
Purchase History
| Date | Buyer | Sale Price | Title Company |
|---|---|---|---|
| Plunkett Brian E | $137,500 | -- |
Source: Public Records
Mortgage History
| Date | Status | Borrower | Loan Amount |
|---|---|---|---|
| Open | Plunkett Brian E | $120,000 | |
| Closed | Plunkett Brian E | $117,000 | |
| Previous Owner | Plunkett Brian E | $30,985 |
Source: Public Records
Tax History Compared to Growth
Tax History
| Year | Tax Paid | Tax Assessment Tax Assessment Total Assessment is a certain percentage of the fair market value that is determined by local assessors to be the total taxable value of land and additions on the property. | Land | Improvement |
|---|---|---|---|---|
| 2025 | $7,786 | $569,600 | $211,400 | $358,200 |
| 2024 | $7,583 | $547,900 | $203,300 | $344,600 |
| 2023 | $7,423 | $513,700 | $203,300 | $310,400 |
| 2022 | $6,964 | $446,400 | $169,500 | $276,900 |
| 2021 | $5,570 | $326,700 | $162,800 | $163,900 |
| 2020 | $5,434 | $314,300 | $156,600 | $157,700 |
| 2019 | $5,303 | $302,000 | $149,700 | $152,300 |
| 2018 | $5,171 | $287,900 | $149,700 | $138,200 |
| 2017 | $5,022 | $274,400 | $142,700 | $131,700 |
| 2016 | $4,889 | $269,200 | $142,700 | $126,500 |
| 2015 | $4,765 | $268,300 | $141,700 | $126,600 |
| 2014 | $4,574 | $263,300 | $138,800 | $124,500 |
Source: Public Records
Map
Nearby Homes
- 1247 Central St
- 936 Central St
- 5 Della Way
- 844 Washington St
- 1 Simmons Place
- 9 Daisy Ln
- 182 Crystal Water Dr Unit 182
- 217 Crystal Water Dr
- 28 Brookbend Way E
- 78 Crystal Water Dr
- 170 Elm St
- 51 Stonegate Dr
- 587 Bridge St
- 1993 Washington St
- 71 Stonegate Dr
- 26 Meadowbrook Dr
- 2045 Washington St
- 14 Mountain Ash Rd
- 94 Pond St
- 22 Hudson St