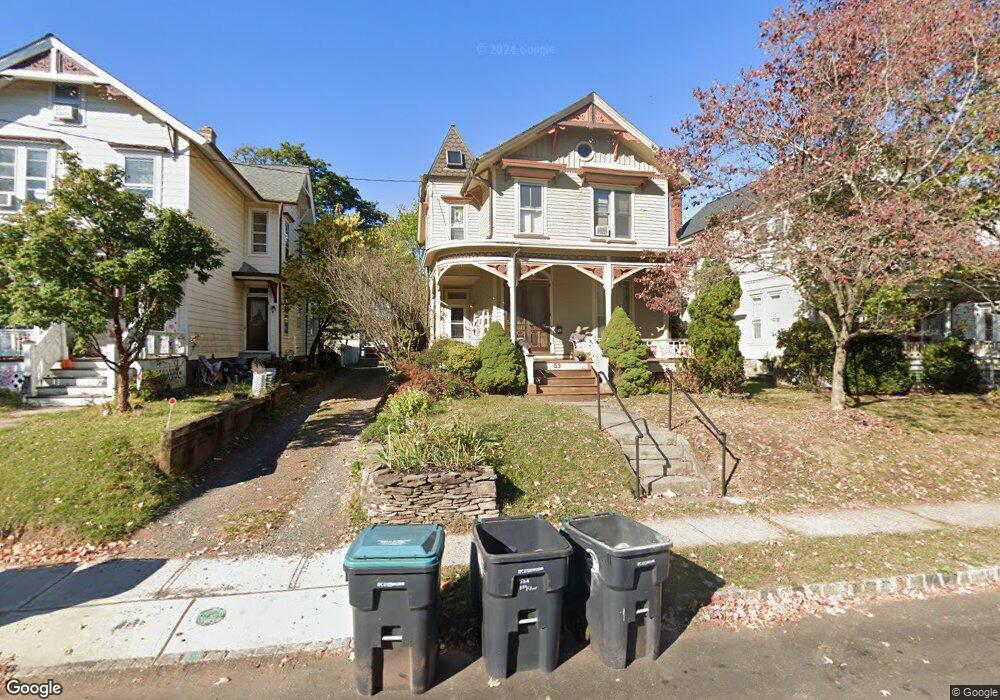
53 Broad St Unit 2 Flemington, NJ 08822
Estimated Value: $487,000 - $528,561
3
Beds
1
Bath
1,849
Sq Ft
$276/Sq Ft
Est. Value
About This Home
This home is located at 53 Broad St Unit 2, Flemington, NJ 08822 and is currently estimated at $509,890, approximately $275 per square foot. 53 Broad St Unit 2 is a home located in Hunterdon County with nearby schools including Francis A. Desmares Elementary School, Reading Fleming Intermediate School, and J.P. Case Middle School.
Ownership History
Date
Name
Owned For
Owner Type
Purchase Details
Closed on
Aug 29, 2024
Sold by
Barbieri Carol J
Bought by
Ricardo And Anas Llc
Current Estimated Value
Home Financials for this Owner
Home Financials are based on the most recent Mortgage that was taken out on this home.
Original Mortgage
$367,500
Interest Rate
6.35%
Mortgage Type
New Conventional
Purchase Details
Closed on
Sep 14, 1989
Sold by
Sarge William T and Sarge Paula J
Bought by
Barbieri Carol J
Create a Home Valuation Report for This Property
The Home Valuation Report is an in-depth analysis detailing your home's value as well as a comparison with similar homes in the area
Home Values in the Area
Average Home Value in this Area
Purchase History
| Date | Buyer | Sale Price | Title Company |
|---|---|---|---|
| Ricardo And Anas Llc | $490,000 | American Land Title | |
| Ricardo And Anas Llc | $490,000 | American Land Title | |
| Barbieri Carol J | $173,900 | -- |
Source: Public Records
Mortgage History
| Date | Status | Borrower | Loan Amount |
|---|---|---|---|
| Previous Owner | Ricardo And Anas Llc | $367,500 |
Source: Public Records
Tax History
| Year | Tax Paid | Tax Assessment Tax Assessment Total Assessment is a certain percentage of the fair market value that is determined by local assessors to be the total taxable value of land and additions on the property. | Land | Improvement |
|---|---|---|---|---|
| 2025 | $10,101 | $412,900 | $134,400 | $278,500 |
| 2024 | $9,753 | $358,700 | $123,200 | $235,500 |
| 2023 | $9,753 | $336,300 | $115,100 | $221,200 |
| 2022 | $9,618 | $319,200 | $107,600 | $211,600 |
| 2021 | $9,240 | $306,100 | $102,400 | $203,700 |
| 2020 | $9,540 | $300,200 | $101,300 | $198,900 |
| 2019 | $9,240 | $297,100 | $99,800 | $197,300 |
| 2018 | $9,015 | $294,500 | $98,800 | $195,700 |
| 2017 | $8,894 | $288,200 | $98,800 | $189,400 |
| 2016 | $8,899 | $283,400 | $98,800 | $184,600 |
| 2015 | $8,545 | $279,800 | $98,800 | $181,000 |
| 2014 | $8,165 | $275,000 | $98,800 | $176,200 |
Source: Public Records
Map
Nearby Homes
- 81 Elwood Ave
- 92 Park Ave
- 12 Corcoran St
- 312 George Wilson Blvd
- 1 Walters Ln
- 29 Royal Rd
- 8 Village Ct
- 237A S Main St Unit A
- 237A S Main St
- 101 Village Commons
- 504 Clark Cir
- 100 State Route 12
- 3 Vinson Dr
- 1 Vinson Dr
- 602 Village Commons
- 603 Nottingham Way
- 16 Hancock Ct
- 106 Franklin Ct Unit 238
- 14 Pony Ln
- 208 Blackberry Ct
Your Personal Tour Guide
Ask me questions while you tour the home.