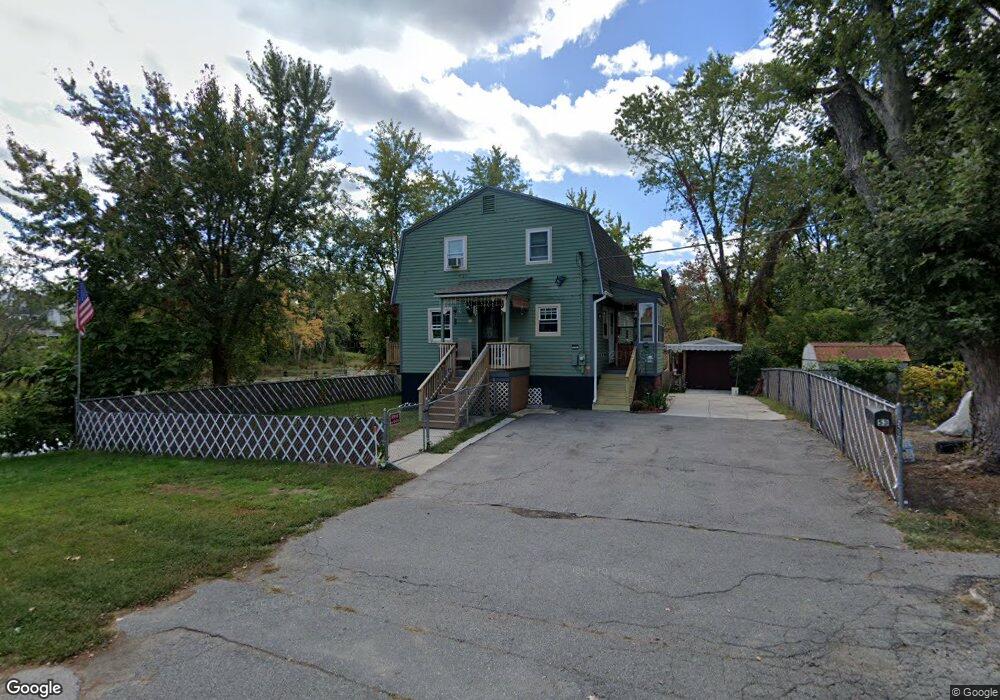
53 Caleb St Lowell, MA 01851
Highlands NeighborhoodEstimated Value: $492,000 - $584,000
4
Beds
1
Bath
1,692
Sq Ft
$316/Sq Ft
Est. Value
About This Home
This home is located at 53 Caleb St, Lowell, MA 01851 and is currently estimated at $534,089, approximately $315 per square foot. 53 Caleb St is a home located in Middlesex County with nearby schools including Charles W. Morey Elementary School, Dr. Gertrude Bailey Elementary School, and Joseph McAvinnue Elementary School.
Ownership History
Date
Name
Owned For
Owner Type
Purchase Details
Closed on
Oct 24, 2007
Sold by
Cit Group Finance Inc
Bought by
Brooks Tammy and Foote Wilfred
Current Estimated Value
Home Financials for this Owner
Home Financials are based on the most recent Mortgage that was taken out on this home.
Original Mortgage
$216,404
Outstanding Balance
$136,369
Interest Rate
6.39%
Mortgage Type
Purchase Money Mortgage
Estimated Equity
$397,720
Purchase Details
Closed on
Jul 5, 2007
Sold by
Co Lan D and Cit Group & Consumer Fin
Bought by
Cit Group & Consumer Fin
Purchase Details
Closed on
Jul 12, 2004
Sold by
Thompson Ft and Thompson
Bought by
Co Lan D and Co Vivian L
Home Financials for this Owner
Home Financials are based on the most recent Mortgage that was taken out on this home.
Original Mortgage
$196,000
Interest Rate
6.32%
Mortgage Type
Purchase Money Mortgage
Create a Home Valuation Report for This Property
The Home Valuation Report is an in-depth analysis detailing your home's value as well as a comparison with similar homes in the area
Home Values in the Area
Average Home Value in this Area
Purchase History
| Date | Buyer | Sale Price | Title Company |
|---|---|---|---|
| Brooks Tammy | $219,800 | -- | |
| Brooks Tammy | $219,800 | -- | |
| Cit Group & Consumer Fin | $216,212 | -- | |
| Cit Group&Consumer Fin | $216,212 | -- | |
| Co Lan D | $245,000 | -- | |
| Co Lan D | $245,000 | -- |
Source: Public Records
Mortgage History
| Date | Status | Borrower | Loan Amount |
|---|---|---|---|
| Open | Brooks Tammy | $216,404 | |
| Closed | Co Lan D | $216,404 | |
| Previous Owner | Co Lan D | $196,000 |
Source: Public Records
Tax History
| Year | Tax Paid | Tax Assessment Tax Assessment Total Assessment is a certain percentage of the fair market value that is determined by local assessors to be the total taxable value of land and additions on the property. | Land | Improvement |
|---|---|---|---|---|
| 2025 | $5,053 | $440,200 | $187,300 | $252,900 |
| 2024 | $5,096 | $427,900 | $175,000 | $252,900 |
| 2023 | $4,790 | $385,700 | $152,200 | $233,500 |
| 2022 | $4,317 | $340,200 | $138,400 | $201,800 |
| 2021 | $4,027 | $299,200 | $120,300 | $178,900 |
| 2020 | $3,800 | $284,400 | $113,100 | $171,300 |
| 2019 | $3,570 | $254,300 | $96,200 | $158,100 |
| 2018 | $3,540 | $246,000 | $91,600 | $154,400 |
| 2017 | $3,411 | $228,600 | $83,300 | $145,300 |
| 2016 | $3,449 | $227,500 | $83,200 | $144,300 |
| 2015 | $3,283 | $212,100 | $83,200 | $128,900 |
| 2013 | $3,071 | $204,600 | $87,200 | $117,400 |
Source: Public Records
Map
Nearby Homes
- 4 Tamarack St
- 694 Westford St
- 977 Westford St Unit 4
- 339 Pawtucket Blvd Unit 19
- 1311 Middlesex St
- 295 Pawtucket Blvd Unit 7
- 351 Pawtucket Blvd Unit 3
- 351 Pawtucket Blvd Unit 29
- 311 Pawtucket Blvd Unit 9
- 311 Pawtucket Blvd Unit 3
- 527 Pawtucket Blvd Unit 207
- 307 Pawtucket Blvd Unit 24
- 45 Harvard St Unit 5 3rd fl
- 142 Sanders Ave
- 49 Marginal St
- 591 Varnum Ave
- 15 Barbara St
- 1975 Middlesex St Unit 51
- 1975 Middlesex St Unit 10
- 137 Pine St Unit 11
Your Personal Tour Guide
Ask me questions while you tour the home.