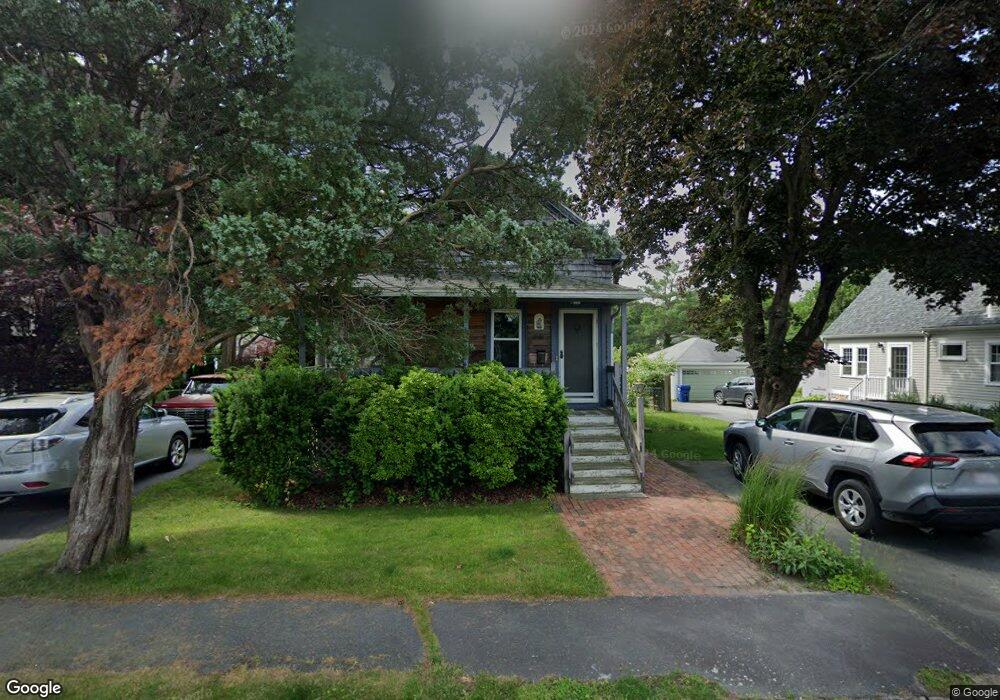
53 Cedar St Fairhaven, MA 02719
Estimated Value: $389,569 - $456,000
3
Beds
1
Bath
798
Sq Ft
$527/Sq Ft
Est. Value
About This Home
This home is located at 53 Cedar St, Fairhaven, MA 02719 and is currently estimated at $420,392, approximately $526 per square foot. 53 Cedar St is a home located in Bristol County with nearby schools including Fairhaven High School, City On A Hill Charter Public School New Bedford, and St. Joseph School.
Ownership History
Date
Name
Owned For
Owner Type
Purchase Details
Closed on
Jan 22, 2026
Sold by
Watts Marilyn M Est and Watts
Bought by
Watts Danica
Current Estimated Value
Purchase Details
Closed on
Nov 25, 1997
Sold by
Wiley Mark B and Wiley Esther V
Bought by
Watts Marilyn M
Home Financials for this Owner
Home Financials are based on the most recent Mortgage that was taken out on this home.
Original Mortgage
$97,800
Interest Rate
7.17%
Mortgage Type
Purchase Money Mortgage
Purchase Details
Closed on
Oct 3, 1988
Sold by
Margeson Steven
Bought by
Wiley Mark B
Home Financials for this Owner
Home Financials are based on the most recent Mortgage that was taken out on this home.
Original Mortgage
$83,300
Interest Rate
10.66%
Mortgage Type
Purchase Money Mortgage
Create a Home Valuation Report for This Property
The Home Valuation Report is an in-depth analysis detailing your home's value as well as a comparison with similar homes in the area
Home Values in the Area
Average Home Value in this Area
Purchase History
| Date | Buyer | Sale Price | Title Company |
|---|---|---|---|
| Watts Danica | -- | -- | |
| Watts Marilyn M | $103,000 | -- | |
| Wiley Mark B | $98,000 | -- |
Source: Public Records
Mortgage History
| Date | Status | Borrower | Loan Amount |
|---|---|---|---|
| Previous Owner | Wiley Mark B | $97,800 | |
| Previous Owner | Wiley Mark B | $85,000 | |
| Previous Owner | Wiley Mark B | $83,300 | |
| Previous Owner | Wiley Mark B | $10,000 |
Source: Public Records
Tax History
| Year | Tax Paid | Tax Assessment Tax Assessment Total Assessment is a certain percentage of the fair market value that is determined by local assessors to be the total taxable value of land and additions on the property. | Land | Improvement |
|---|---|---|---|---|
| 2025 | $29 | $316,100 | $170,700 | $145,400 |
| 2024 | $2,892 | $313,300 | $170,700 | $142,600 |
| 2023 | $2,772 | $278,600 | $149,500 | $129,100 |
| 2022 | $2,686 | $262,800 | $138,900 | $123,900 |
| 2021 | $7,594 | $226,400 | $125,700 | $100,700 |
| 2020 | $2,504 | $226,400 | $125,700 | $100,700 |
| 2019 | $2,300 | $197,100 | $104,300 | $92,800 |
| 2018 | $5,606 | $187,100 | $99,200 | $87,900 |
| 2017 | $5,217 | $180,300 | $99,200 | $81,100 |
| 2016 | $2,113 | $173,500 | $99,200 | $74,300 |
| 2015 | $2,089 | $171,900 | $99,200 | $72,700 |
Source: Public Records
Map
Nearby Homes
- 32 Cedar St
- 2 Washburn Ave
- 11 Lawton St
- 32 Green St
- 58 Washington St
- 24 Middle St
- 0 Nulands Neck Unit 73286360
- 145 Pleasant St
- 8 Washington St
- 8 Manor Dr
- 58 Bayview Ave
- 181 Washington St
- 77 Adams St
- 39 Christian St
- 27 Bayview Ave
- 15 Bayview Ave
- 67 Bridge St
- 138 Main St Unit 13
- 00 Copeland St
- 16 Ash St
Your Personal Tour Guide
Ask me questions while you tour the home.