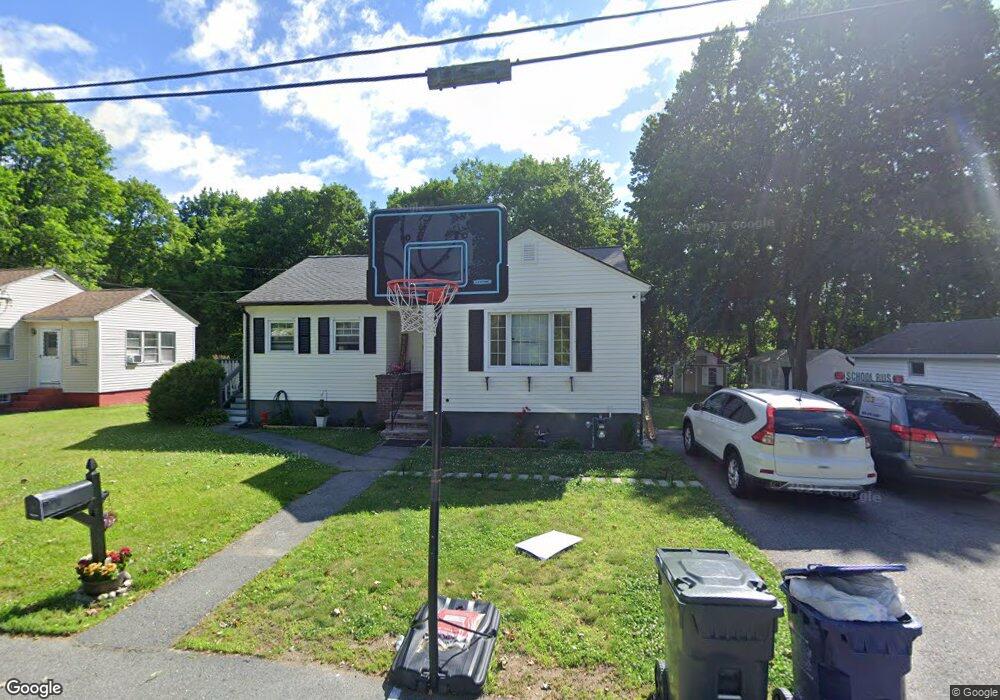
53 Champlain St Dracut, MA 01826
Estimated Value: $407,000 - $523,000
2
Beds
1
Bath
1,028
Sq Ft
$454/Sq Ft
Est. Value
About This Home
This home is located at 53 Champlain St, Dracut, MA 01826 and is currently estimated at $466,635, approximately $453 per square foot. 53 Champlain St is a home located in Middlesex County with nearby schools including Greenmont Avenue School, Richardson Middle School, and Dracut Senior High School.
Ownership History
Date
Name
Owned For
Owner Type
Purchase Details
Closed on
Oct 25, 2024
Sold by
Rodriguez Felicia A
Bought by
Rodriguez Felicia A
Current Estimated Value
Home Financials for this Owner
Home Financials are based on the most recent Mortgage that was taken out on this home.
Original Mortgage
$315,000
Outstanding Balance
$309,542
Interest Rate
6.09%
Mortgage Type
New Conventional
Estimated Equity
$157,093
Purchase Details
Closed on
Nov 30, 2023
Sold by
Niemi David
Bought by
Rodriguez Felicia and Disla Albania M
Home Financials for this Owner
Home Financials are based on the most recent Mortgage that was taken out on this home.
Original Mortgage
$310,215
Interest Rate
7.63%
Mortgage Type
Purchase Money Mortgage
Purchase Details
Closed on
Jul 2, 2014
Sold by
Sullivan Mary J Est and Wallace
Bought by
Niemi 3Rd David A
Home Financials for this Owner
Home Financials are based on the most recent Mortgage that was taken out on this home.
Original Mortgage
$208,160
Interest Rate
4.16%
Mortgage Type
FHA
Create a Home Valuation Report for This Property
The Home Valuation Report is an in-depth analysis detailing your home's value as well as a comparison with similar homes in the area
Home Values in the Area
Average Home Value in this Area
Purchase History
| Date | Buyer | Sale Price | Title Company |
|---|---|---|---|
| Rodriguez Felicia A | -- | None Available | |
| Rodriguez Felicia | -- | None Available | |
| Rodriguez Felicia | $360,000 | None Available | |
| Niemi 3Rd David A | $212,000 | -- | |
| Niemi 3Rd David A | $212,000 | -- |
Source: Public Records
Mortgage History
| Date | Status | Borrower | Loan Amount |
|---|---|---|---|
| Open | Rodriguez Felicia | $315,000 | |
| Closed | Rodriguez Felicia A | $315,000 | |
| Previous Owner | Rodriguez Felicia | $310,215 | |
| Previous Owner | Niemi 3Rd David A | $208,160 |
Source: Public Records
Tax History
| Year | Tax Paid | Tax Assessment Tax Assessment Total Assessment is a certain percentage of the fair market value that is determined by local assessors to be the total taxable value of land and additions on the property. | Land | Improvement |
|---|---|---|---|---|
| 2025 | $4,315 | $426,400 | $194,800 | $231,600 |
| 2024 | $4,293 | $410,800 | $185,500 | $225,300 |
| 2023 | $4,117 | $355,500 | $161,300 | $194,200 |
| 2022 | $4,024 | $327,400 | $146,600 | $180,800 |
| 2021 | $3,885 | $298,600 | $133,200 | $165,400 |
| 2020 | $3,745 | $280,500 | $129,400 | $151,100 |
| 2019 | $5,962 | $264,300 | $123,200 | $141,100 |
| 2018 | $4,913 | $241,700 | $123,200 | $118,500 |
| 2017 | $3,409 | $241,700 | $123,200 | $118,500 |
| 2016 | $3,274 | $220,600 | $118,400 | $102,200 |
| 2015 | $3,180 | $213,000 | $118,400 | $94,600 |
| 2014 | $2,976 | $205,400 | $118,400 | $87,000 |
Source: Public Records
Map
Nearby Homes
- 54 Montaup Ave
- 69 Arlington St
- 173 Greenmont Ave
- 1563 Bridge St
- 1573 Bridge St
- 175 Willard St Unit 9
- 287 Fox Ave
- 700 Robbins Ave Unit 6
- 12 Tanglewood Dr
- 112 Genest St Unit 12
- 112 Genest St Unit 14
- 112 Genest St Unit 15
- 112 Genest St Unit 11
- 112 Genest St Unit 8
- 112 Genest St Unit 10
- 112 Genest St Unit 13
- 668 Robbins Ave Unit 1
- 10 Lanseigne St
- 551 Hildreth St Unit 21
- 551 Hildreth St Unit 10
- 51 Champlain St
- 59 Champlain St
- 45 Champlain St
- 44 Champlain St
- 46 Champlain St
- 68 Lafayette St
- 46 Lafayette St
- 36 Lafayette St
- 27 Chapman St
- 34 Montaup Ave
- 38 Montaup Ave
- 19 Chapman St Unit 2nd Floor
- 19 Chapman St
- 24 Lafayette St
- 37 Chapman St
- 57 Lafayette St
- 26 Champlain St
- 46 Montaup Ave
- 26 Montaup Ave
- 31 Lafayette St
Your Personal Tour Guide
Ask me questions while you tour the home.