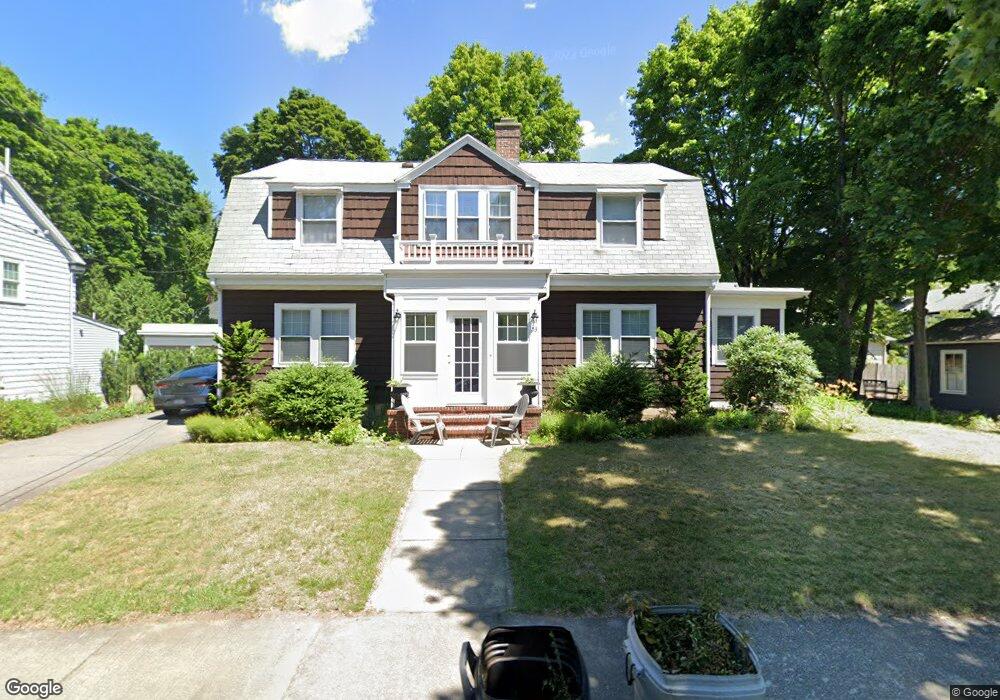
53 Channing Rd Newton Center, MA 02459
Newton Centre NeighborhoodEstimated Value: $1,423,000 - $2,005,000
4
Beds
2
Baths
2,312
Sq Ft
$742/Sq Ft
Est. Value
About This Home
This home is located at 53 Channing Rd, Newton Center, MA 02459 and is currently estimated at $1,714,953, approximately $741 per square foot. 53 Channing Rd is a home located in Middlesex County with nearby schools including Mason Rice Elementary School, Charles E Brown Middle School, and Newton North High School.
Ownership History
Date
Name
Owned For
Owner Type
Purchase Details
Closed on
May 27, 2014
Sold by
Hattis Paul A and Samelson Elizabeth J
Bought by
Paul Hattis T and Samelson Elizabeth J
Current Estimated Value
Purchase Details
Closed on
May 3, 1993
Sold by
Sillman Jonathon S and Sillman Gail D
Bought by
Hattis Paul A and Samelson Elizabeth J
Home Financials for this Owner
Home Financials are based on the most recent Mortgage that was taken out on this home.
Original Mortgage
$273,600
Interest Rate
7.51%
Mortgage Type
Purchase Money Mortgage
Purchase Details
Closed on
Jun 18, 1991
Sold by
Dasarathy B and Dasarathy Yamuna
Bought by
Sillman Jonathan and Sillman Gail D
Home Financials for this Owner
Home Financials are based on the most recent Mortgage that was taken out on this home.
Original Mortgage
$259,000
Interest Rate
9.39%
Mortgage Type
Purchase Money Mortgage
Purchase Details
Closed on
Mar 25, 1988
Sold by
Parkinson David R
Bought by
Dasarathy Yamuna
Create a Home Valuation Report for This Property
The Home Valuation Report is an in-depth analysis detailing your home's value as well as a comparison with similar homes in the area
Home Values in the Area
Average Home Value in this Area
Purchase History
| Date | Buyer | Sale Price | Title Company |
|---|---|---|---|
| Paul Hattis T | -- | -- | |
| Hattis Paul A | $342,000 | -- | |
| Sillman Jonathan | $323,800 | -- | |
| Dasarathy Yamuna | $322,000 | -- |
Source: Public Records
Mortgage History
| Date | Status | Borrower | Loan Amount |
|---|---|---|---|
| Previous Owner | Dasarathy Yamuna | $273,600 | |
| Previous Owner | Dasarathy Yamuna | $56,300 | |
| Previous Owner | Dasarathy Yamuna | $259,000 | |
| Previous Owner | Dasarathy Yamuna | $259,000 |
Source: Public Records
Tax History Compared to Growth
Tax History
| Year | Tax Paid | Tax Assessment Tax Assessment Total Assessment is a certain percentage of the fair market value that is determined by local assessors to be the total taxable value of land and additions on the property. | Land | Improvement |
|---|---|---|---|---|
| 2025 | $14,725 | $1,502,500 | $1,162,500 | $340,000 |
| 2024 | $14,237 | $1,458,700 | $1,128,600 | $330,100 |
| 2023 | $13,508 | $1,326,900 | $855,800 | $471,100 |
| 2022 | $12,925 | $1,228,600 | $792,400 | $436,200 |
| 2021 | $12,472 | $1,159,100 | $747,500 | $411,600 |
| 2020 | $0 | $1,159,100 | $747,500 | $411,600 |
| 2019 | $0 | $1,125,300 | $725,700 | $399,600 |
| 2018 | $11,163 | $1,031,700 | $655,200 | $376,500 |
| 2017 | $10,823 | $973,300 | $618,100 | $355,200 |
| 2016 | $10,351 | $909,600 | $577,700 | $331,900 |
| 2015 | $9,870 | $850,100 | $539,900 | $310,200 |
Source: Public Records
Map
Nearby Homes
- 73 Elmore St
- 3 Cedar St
- 34 Morton Rd
- 1004 Centre St
- 887 Commonwealth Ave
- 95 Blake St
- Lots 2 & 3 Chapin Rd
- Lot 3 Chapin Rd
- Lot 2 Chapin Rd
- 59 Charlotte Rd
- 31 W Boulevard Rd
- 44 Irving St
- 21 Francis St Unit 21A
- 23 Francis St Unit 23-1
- 206-208 Cabot St
- 300 Cabot St
- 61 Lakeview Ave
- 110 Harvard St
- 154 Beaumont Ave
- 54 Garland Rd