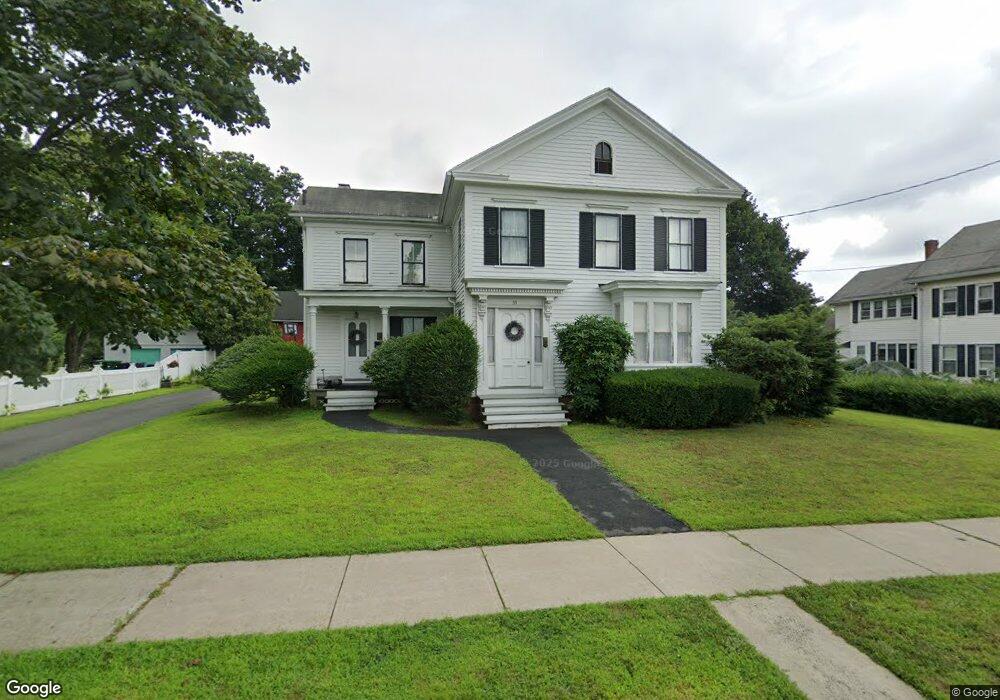
53 Chapin St Chicopee, MA 01013
Chicopee Center NeighborhoodEstimated Value: $315,364 - $415,000
5
Beds
2
Baths
2,558
Sq Ft
$141/Sq Ft
Est. Value
About This Home
This home is located at 53 Chapin St, Chicopee, MA 01013 and is currently estimated at $361,091, approximately $141 per square foot. 53 Chapin St is a home located in Hampden County with nearby schools including Bowe Elementary School, Fairview Middle School, and Chicopee High School.
Ownership History
Date
Name
Owned For
Owner Type
Purchase Details
Closed on
Nov 3, 1988
Sold by
Mielnikowski Fred A
Bought by
Mielnikowski Fred J
Current Estimated Value
Home Financials for this Owner
Home Financials are based on the most recent Mortgage that was taken out on this home.
Original Mortgage
$62,000
Interest Rate
10.33%
Mortgage Type
Purchase Money Mortgage
Create a Home Valuation Report for This Property
The Home Valuation Report is an in-depth analysis detailing your home's value as well as a comparison with similar homes in the area
Home Values in the Area
Average Home Value in this Area
Purchase History
| Date | Buyer | Sale Price | Title Company |
|---|---|---|---|
| Mielnikowski Fred J | $62,000 | -- |
Source: Public Records
Mortgage History
| Date | Status | Borrower | Loan Amount |
|---|---|---|---|
| Open | Mielnikowski Fred J | $24,000 | |
| Closed | Mielnikowski Fred J | $22,383 | |
| Closed | Mielnikowski Fred J | $62,000 |
Source: Public Records
Tax History
| Year | Tax Paid | Tax Assessment Tax Assessment Total Assessment is a certain percentage of the fair market value that is determined by local assessors to be the total taxable value of land and additions on the property. | Land | Improvement |
|---|---|---|---|---|
| 2025 | $4,556 | $300,500 | $72,100 | $228,400 |
| 2024 | $4,307 | $291,800 | $70,600 | $221,200 |
| 2023 | $4,022 | $265,500 | $64,200 | $201,300 |
| 2022 | $3,938 | $231,800 | $55,900 | $175,900 |
| 2021 | $3,737 | $212,200 | $50,800 | $161,400 |
| 2020 | $3,515 | $201,300 | $50,800 | $150,500 |
| 2019 | $3,411 | $189,900 | $50,800 | $139,100 |
| 2018 | $3,334 | $182,100 | $48,400 | $133,700 |
| 2017 | $3,187 | $184,100 | $51,500 | $132,600 |
| 2016 | $2,961 | $175,100 | $51,500 | $123,600 |
| 2015 | $2,947 | $168,000 | $51,500 | $116,500 |
| 2014 | $1,473 | $168,000 | $51,500 | $116,500 |
Source: Public Records
Map
Nearby Homes
- 63 Chapin St
- 43 Chapin St
- 45 Captain Mac St
- 51 Captain Mac St
- 37 Captain Mac St
- 0 Auto Repair St Unit 72636634
- 33 Chapin St
- 73 Chapin St
- 73 Chapin St Unit 2
- 103 Nonotuck Ave Unit 103
- 7 Clinton St
- 25 Captain Mac St
- 125 Nonotuck Ave
- 139 Nonotuck Ave
- 139 Nonotuck Ave Unit 2
- 9 Clinton St
- 30 Captain Mac St
- 23 Chapin St
- 96 Nonotuck Ave
- 96 Nonotuck Ave Unit 1R
Your Personal Tour Guide
Ask me questions while you tour the home.