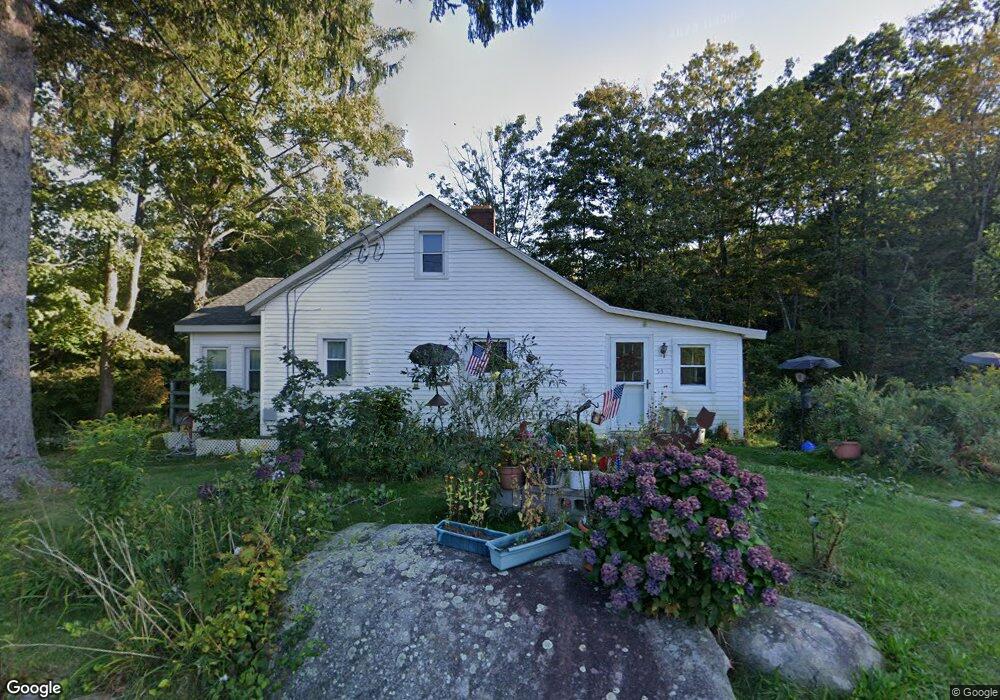
53 Clark Hill Rd East Hampton, CT 06424
Estimated Value: $235,000 - $421,000
2
Beds
2
Baths
1,572
Sq Ft
$210/Sq Ft
Est. Value
About This Home
This home is located at 53 Clark Hill Rd, East Hampton, CT 06424 and is currently estimated at $330,126, approximately $210 per square foot. 53 Clark Hill Rd is a home located in Middlesex County with nearby schools including Memorial School, Center Elementary School, and East Hampton Middle School.
Ownership History
Date
Name
Owned For
Owner Type
Purchase Details
Closed on
Nov 10, 2011
Sold by
Grant Steven
Bought by
Magrath Ethelyn
Current Estimated Value
Purchase Details
Closed on
Feb 22, 2000
Sold by
Wershoven Gregg
Bought by
Grant Steven and Mcgrath Ethelyn
Purchase Details
Closed on
Aug 6, 1998
Sold by
Regional Hldng Co Inc
Bought by
Wershoven Gregg
Create a Home Valuation Report for This Property
The Home Valuation Report is an in-depth analysis detailing your home's value as well as a comparison with similar homes in the area
Home Values in the Area
Average Home Value in this Area
Purchase History
| Date | Buyer | Sale Price | Title Company |
|---|---|---|---|
| Magrath Ethelyn | -- | -- | |
| Magrath Ethelyn | -- | -- | |
| Grant Steven | $99,000 | -- | |
| Grant Steven | $99,000 | -- | |
| Wershoven Gregg | $32,000 | -- | |
| Wershoven Gregg | $32,000 | -- |
Source: Public Records
Mortgage History
| Date | Status | Borrower | Loan Amount |
|---|---|---|---|
| Open | Wershoven Gregg | $48,000 | |
| Previous Owner | Wershoven Gregg | $50,000 |
Source: Public Records
Tax History
| Year | Tax Paid | Tax Assessment Tax Assessment Total Assessment is a certain percentage of the fair market value that is determined by local assessors to be the total taxable value of land and additions on the property. | Land | Improvement |
|---|---|---|---|---|
| 2025 | $4,803 | $120,950 | $28,490 | $92,460 |
| 2024 | $4,601 | $120,950 | $28,490 | $92,460 |
| 2023 | $4,361 | $120,950 | $28,490 | $92,460 |
| 2022 | $4,192 | $120,950 | $28,490 | $92,460 |
| 2021 | $4,176 | $120,950 | $28,490 | $92,460 |
| 2020 | $3,921 | $118,330 | $29,040 | $89,290 |
| 2019 | $3,660 | $110,430 | $29,850 | $80,580 |
| 2018 | $3,459 | $110,430 | $29,850 | $80,580 |
| 2017 | $3,459 | $110,430 | $29,850 | $80,580 |
| 2016 | $3,251 | $110,430 | $29,850 | $80,580 |
| 2015 | $3,175 | $114,280 | $28,730 | $85,550 |
| 2014 | $2,762 | $114,280 | $28,730 | $85,550 |
Source: Public Records
Map
Nearby Homes
Your Personal Tour Guide
Ask me questions while you tour the home.