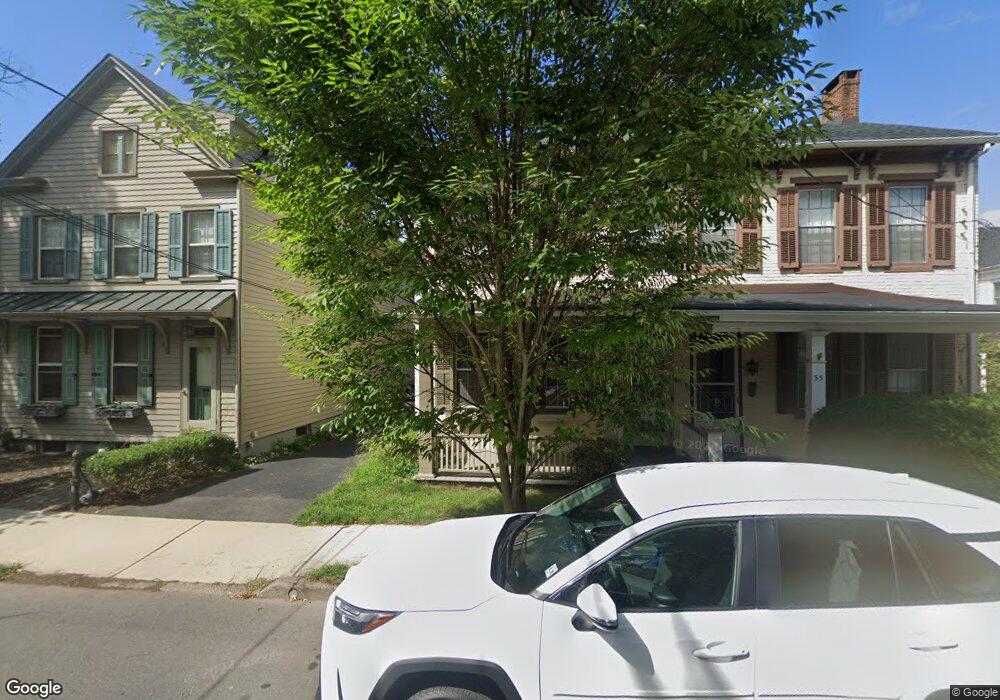
53 Clinton St Lambertville, NJ 08530
Estimated Value: $557,000 - $840,000
--
Bed
--
Bath
1,528
Sq Ft
$443/Sq Ft
Est. Value
About This Home
This home is located at 53 Clinton St, Lambertville, NJ 08530 and is currently estimated at $677,424, approximately $443 per square foot. 53 Clinton St is a home located in Hunterdon County with nearby schools including South Hunterdon Regional Elementary School, South Hunterdon High School, and The Jesus School.
Ownership History
Date
Name
Owned For
Owner Type
Purchase Details
Closed on
Dec 9, 1996
Sold by
Scherrei William and Scherrei Leslie
Bought by
Beyea Jan E
Current Estimated Value
Home Financials for this Owner
Home Financials are based on the most recent Mortgage that was taken out on this home.
Original Mortgage
$93,000
Outstanding Balance
$9,496
Interest Rate
7.75%
Estimated Equity
$667,928
Purchase Details
Closed on
Jun 14, 1993
Sold by
Parent Leroy W and Parent Rhoda L
Bought by
Scherrei William H and Scherrei Leslie
Create a Home Valuation Report for This Property
The Home Valuation Report is an in-depth analysis detailing your home's value as well as a comparison with similar homes in the area
Home Values in the Area
Average Home Value in this Area
Purchase History
| Date | Buyer | Sale Price | Title Company |
|---|---|---|---|
| Beyea Jan E | $173,000 | -- | |
| Scherrei William H | $135,000 | -- |
Source: Public Records
Mortgage History
| Date | Status | Borrower | Loan Amount |
|---|---|---|---|
| Open | Beyea Jan E | $93,000 |
Source: Public Records
Tax History Compared to Growth
Tax History
| Year | Tax Paid | Tax Assessment Tax Assessment Total Assessment is a certain percentage of the fair market value that is determined by local assessors to be the total taxable value of land and additions on the property. | Land | Improvement |
|---|---|---|---|---|
| 2025 | $12,112 | $541,900 | $382,300 | $159,600 |
| 2024 | $11,890 | $524,100 | $367,300 | $156,800 |
| 2023 | $11,890 | $507,700 | $352,300 | $155,400 |
| 2022 | $11,497 | $497,700 | $342,300 | $155,400 |
| 2021 | $9,795 | $476,700 | $321,300 | $155,400 |
| 2020 | $10,499 | $472,700 | $317,300 | $155,400 |
| 2019 | $9,795 | $462,700 | $307,300 | $155,400 |
| 2018 | $9,647 | $462,700 | $307,300 | $155,400 |
| 2017 | $9,138 | $447,700 | $292,300 | $155,400 |
| 2016 | $8,558 | $427,700 | $272,300 | $155,400 |
| 2015 | $8,500 | $421,400 | $267,300 | $154,100 |
| 2014 | $8,399 | $421,400 | $267,300 | $154,100 |
Source: Public Records
Map
Nearby Homes